
The non-mythical Adam and Eve!
Refuting errors by Francis Collins and BioLogos

In recent weeks, we have received multiple inquiries about the historicity of Adam and Eve, including e-mail questions coming through creation.com,1 questions after church talks, seminary courses we have given, call-in questions during radio interviews, and questions after conference presentations. This has been precipitated by a significant amount of press coverage of Francis Collins and the other members of his organization, BioLogos.2 Collins was the director of the Human Genome Project, and is currently serving as the director of the National Institutes of Health, so he is no lightweight in science. Also, Collins claims to be an evangelical Christian. When a person of his caliber speaks on the relationship between science and faith, people sit up and listen.
Yet, the things he has been saying are completely opposed to what CMI believes and what the Bible clearly teaches.3 The rash of questions we have received of late center around his claims that there is no evidence for Adam and Eve and that there is no physical way we could have come from two ancestors in the recent past. A high profile article appeared in Christianity Today last June, in which the following quotes appeared:
“Collins’s 2006 bestseller, The Language of God: A Scientist Presents Evidence for Belief[4] … reported scientific indications that anatomically modern humans emerged from primate ancestors perhaps 100,000 years ago—long before the Genesis time frame—and originated with a population that numbered something like 10,000, not two individuals.”
and
“In a recent pro-evolution book from InterVarsity Press, The Language of Science and Faith, Collins and co-author Karl W. Giberson escalate matters, announcing that ‘unfortunately’ the concepts of Adam and Eve as the literal first couple and the ancestors of all humans simply ‘do not fit the evidence’.”5
Collins has not restricted himself to the printed word, however, as he has been saying things like this all over the country, including a recent address he gave at Pepperdine University, when he said:
“There is no way you can develop this level of variation between us from one or two ancestors.”6
During an interview on National Public Radio he reiterated these claims, as did another BioLogos fellow, Dennis Venema, who said:
“You would have to postulate that there’s been this absolutely astronomical mutation rate that has produced all these new variants in an incredibly short period of time. Those types of mutation rates are just not possible. It would mutate us out of existence.”7
BioLogos has thrown down the gauntlet, and, because of their status, theistic evolution seems to have suddenly come from a dismal place in the rear to perhaps the forefront of all the alternative views of Genesis. Yet, not everybody has been convinced by the strength of their arguments. In that same NPR piece, Al Mohler, President of the Southern Baptist Theological Seminary,8 said,
“The moment you say ‘We have to abandon this theology in order to have the respect of the world,’ you end up with neither biblical orthodoxy nor the respect of the world.”9
Mohler and others like him are willing to stand in the face of a significant challenge. Why is this? Perhaps it is because Dr. Mohler knows more than the average person about the relationship between science and faith. Could it be that he also knows more about science in general? Mohler is certainly right about the lack of respect one receives from the world when they mix evolution and Christianity. See the contempt coming from arch-atheist Richard Dawkins:
“Oh, but of course, the story of Adam and Eve was only ever symbolic, wasn’t it? Symbolic? So, in order to impress himself, Jesus had himself tortured and executed, in vicarious punishment for a symbolic sin committed by a non-existent individual? As I said, barking mad, as well as viciously unpleasant.”10
Dawkins pulls no punches when dealing with Christians who also hold to evolution:
“I think the evangelical Christians have really sort of got it right in a way, in seeing evolution as the enemy. Whereas the more, what shall we say, sophisticated theologians are quite happy to live with evolution, I think they’re deluded. I think the evangelicals have got it right, in that there really is a deep incompatibility between evolution and Christianity … ”11
Getting to the root issue
It cannot be overstated that in each of the examples given above, the two theistic evolutionists are basing their conclusions on evolutionary assumptions. Specifically, they are appealing to deep time common ancestry mutation/drift/selection as the sole explanation of human genetics. They do indeed have a tremendous amount of data available to them, including the massive amounts generated by the Human Genome Project,12 the ENCODE project,13 the HapMap project,14 and the ongoing Thousand Genomes project. Yet, since these are public databases, creationists have access to the same data. Even while the world is soaking up their claims, why is it that the creationists are not running away?

Needless to say, I take great exception to the dogmatism of the BioLogos spokespeople. I do not believe the data support their conclusions and I believe it is entirely unfair to exclude the creation model without ever considering what the implications of the model would be (in scientific terms, they failed to propose a null hypothesis that could be ruled out by the evidence). I have written about the predictions of a straightforward biblical model several times, including my articles on Adam, Eve, and Noah vs. Modern Genetics, The Neutral Model of Evolution and Recent African Origins, and Does Genetics Point to a Single Primal Couple?
There are two issues at hand. The first is their a priori exclusion of the biblical model from any and all consideration—following ardent atheists like Richard Lewontin. The second is their appeal to mutation as the sole source of genetic diversity. Of course there has not been enough time to accumulate all the diversity we see in people today if Adam was homozygous at all loci.15 But that is a straw-man argument. Why would anyone believe Adam had no genetic diversity built into his genome from the beginning?
As we will see, the amount of genetic diversity within people alive today, coupled with the distribution of alleles among world populations, is strong testimony to an original Adam. Add this to the genetic effects of the biblical Flood (with its severe but short population bottleneck) and the Tower of Babel (with its subsequent partitioning of the genes that were formerly on board the Ark) and we can go a long way to explain human genetic history, from a biblical perspective, while using the genetic data available to date.
Analysis of the data at hand
  |
I believe Collins et al. have made a grievous mistake and that the data actually stand in contradiction to their claims. The remainder of my arguments will focus on an analysis of the HapMap16 data. This particular dataset includes over 1,300 people from 11 world populations. HapMap sequenced over one million individual DNA ‘letters’ (nucleotides) scattered through the genomes of each person in the study, with an average distance of 2,800 nucleotides between the sequenced letters.17 Thus, they covered a huge proportion of human genetic diversity and one can use the data to address many questions about human history. In fact, I have this data on hand and have spent a considerable amount of time analyzing it as I attempt to build a creationist model of human genetic history (I am not working on this alone!).
There are approximately 10 million common variants in the human genome. Most of these (several million) are quite common and can be found in most or all world populations. HapMap chose to focus on a selection of these.
When I began to analyze the data, I was at first struck by several things that appeared to support the evolutionary model. For example, Figure 1 displays the relative proportions of the alleles analyzed by HapMap. One can easily see that the bulk of allelic variants are transitions18 (A/G or C/T). These are chemically (thus statistically) more likely than the transversions (A/C, A/T, C/G or G/T). Why are the two types of transitions evenly balanced? Because an A to G change on one strand creates a T to C change on the reverse strand of DNA, and vice versa. Given millions of years of random mutation, one might expect to find 1) more transitions than transversions and 2) equal levels of the reverse complements, because mutations should appear randomly on either strand. This second rule is followed in all the variant classes except between A/T and C/G, and could be interpreted as functional conservation of C and G position in the genome. This is not evidence against the creation model, however, as I do not believe the creation model makes any specific prediction about these ratios.19
A second type of analysis that seems to support the evolutionary model can be seen in Figure 2, where I plot the allele frequencies of all A/G variants on human chromosome 22 within the CEU population (people of European descent). There is a continuous distribution in this figure, with all possible frequencies of A and G found among the many alleles. At first glance, this appears to reflect millions of years of mutation, selection, and drift, for it would take a very long time for any new mutation (by definition starting at a very low frequency in the population) to approach anything like 10%, let alone 40 or 50%.
George Campbell, the politically and scientifically astute 8th Duke of Argyll wrote an essay in the late 1800s where he excoriates the “reign of terror” precipitated by the evolutionists against all opponents. While discussing how one of Darwin’s pet theories (on coral atoll formation) had been disproved after many years of strident support, he said, “And here we learn the important lesson that an hypothesis may adequately account for actual facts, and yet nevertheless may not be true.”20,21 We would do well to heed this warning, for the HapMap data, and the theistic and non-theistic evolutionists’ analyses of these data, are not what they seem at first glance.

In order to illustrate why Figure 2 is not predicted by evolutionary theory, refer to Figure 3. In this theoretical population of 10 reproducing couples, an allele starts off with ten variants (A–J). If this were mtDNA, only the females would be shown. To keep the population constant, each couple has 0, 1, or 2 female children, at random, each generation. It is easy to see that one or more variants are lost from this small population for the first several generations. Eventually, only two variants are left (F and I). At generation 12, they both represent half of the lineages and have an equal probability of persisting, but, due to chance alone, one of them eventually goes extinct. This is a simple illustration of genetic drift, but it illustrates one salient point—the likelihood of an allele reaching fixation is equal to its frequency at any specific point in time. Rare alleles are more likely to be lost. Common alleles are more likely to persist and are more likely to run to fixation.

In Figure 4, I show the results of mutation accumulation in a theoretical human population modeled with the program Mendel’s Accountant.23 This is a typical result that can be obtained using a range of parameter settings in both stationary and slowly-growing populations. Despite several thousand generations of selection and drift, there are few mutations in the central portion of the chart. This is due to drift. New mutations are, by definition, rare and are found on the left-hand edge. Thus, there will always be more rare alleles than common ones. These new alleles are constantly being pushed off the chart to the left by random drift. The infrequent mutation that reaches over 50% abundance suddenly experiences a ‘push’ to the right. Thus, the center is like a hill, with drift pushing alleles away from the middle in either direction. Because most of the mutations that enter from the left are lost, one would never expect an even distribution as in Figure 2.
Even though Figure 2 appears at first to support evolutionary theory, in fact it does not. The allele frequency distribution has too many alleles in the middle range. HapMap sequenced common alleles by design, ignoring rare alleles restricted to certain subgroups. In so doing, it did two things: 1) revealed the many unexpected alleles in the middle range, 2) inadvertently focused on ‘created diversity’ (more below), and 3) gave us a wonderful model of the effects of starting from a single ancestral pair only several thousand years ago.

What would we expect if the Bible were true?
Why is it that nobody at BioLogos has appeared to address the biblical model? Why have they swallowed the assumptions of evolutionary theory wholesale and used those assumptions to make strong conclusions in support of this theory? Their circular reasoning is obvious. However, it would not be wise to stop there. We need to introduce a model of what we would expect to be true if Adam really lived and if he lived only 6,000 years ago.
In Figure 5, I display a theoretical allele frequency curve for the human “population” at Creation. Here, I am assuming that Eve is a clone of Adam, because she was made from a hunk of Adam’s flesh (albeit the one bone that can re-grow). In this case, because she was female, Adam’s Y chromosome would have been removed and his X chromosome doubled, although this is not specifically necessary genetically or theologically.24
When Adam and Eve start having children, they are going to be given a random set of the alleles within the parents. In the case of two heterozygous individuals, we would expect 25% of the allele in each child to be AA, 50% to be AG, and 25% to be GG, according to the laws of genetics we all learned in school. Assuming no linkage, the allele frequency curve for each individual would appear as in Figure 6.
 |
 |
 |
 |
If we pool their children to create a population-level allele frequency curve, we get the results we see in Figures 7–9.
Can you see what is happening in Figures 7–9?25 As more children are added to the population, the population-level allele frequency curve starts to approach the initial, flat-line distribution of Adam (Figure 5). If Adam and Eve could have had a million children, the curve would be perfectly flat. However, they were limited in how many children they could have had and so the allele frequencies must drift in the first generation, with the amount of drift depending on the number of children. We are still far away from the HapMap distribution of Figure 2, but this is a step in the right direction. If we add new mutations to the population over time, however, low-frequency mutations will be added to the curve, as modeled in Figure 10. This is an additional step toward the distribution of Figure 2.

Computer modeling of biblical genetics
At this point, we need something more powerful to model allele frequency changes in human history under the biblical parameters. To do this, I wrote a program in Perl that starts with a founder (Adam) and assigns him 1,000 heterozygous alleles. I assume Eve is a clone26 and give her the same set of variations. As they start having children, the children will be assigned a spouse after reaching a user-defined age of maturation. Spouses are chosen at random from all available unmarried people of the opposite sex. I assume mating for life. Also, unlike many other modeling programs that use discrete generations, I use overlapping generations. Thus, a person can marry anyone of the opposite sex, regardless of age (although an old, unmarried person is unlikely to exist) or relational status (with the exception of ancestors). Because I am tracking individuals, not averages, there is a greater demand on memory allocation, so the size of the population I am able to model is limited. However, this does allow me to model something that should more or less reflect biblical history.
There are three main parameters in this population model, the age of sexual maturity (Ym), the age of reproductive senescence (Ys), and the spacing between children (Yc). The combination of these three controls the total number of children per family and this, in turn, directly controls the amount of drift in subsequent generations (Figure 11).
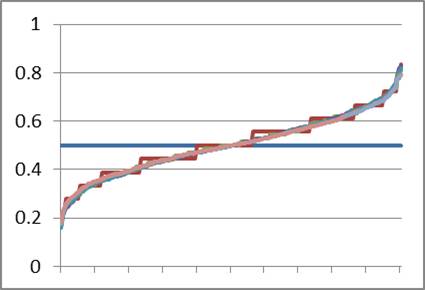
The evolutionary models espoused by BioLogos and others depend on genetic drift and natural selection to influence allele frequencies. Because drift occurs so slowly in a large population, millions of years are needed to account for the allele frequency spectrum of modern man. The biblical model, however, starts with the smallest population possible (two individuals) and expects rapid drift in the antediluvian population. What would occur at the Flood, over a millennium and a half later, when the world population was reduced to eight people, with only three reproducing couples, of whom the three men are brothers? Using the same parameters as in Figure 11, I ran the model to simulate 1,500 years of marriage and birth, stopping every 500 years to reduce the population to three founding couples made up of three brothers (full siblings) and three women selected at random from the available unmarried women (Figure 12). From Figure 11, I knew that drift would effectively stop in any exponentially growing population prior to 500 years, so this seemed like a fair strategy.
What can we learn from Figure 12? First, as before, drift occurs from Adam and Eve (horizontal blue line) to the first sampling at 100 years (jagged brown line) and nearly no drift is noticeable 400 years later (smooth green line). A bottleneck occurred after year 500. One hundred years later, the population has drifted even farther (jagged dark blue line). In fact, each bottleneck drives the allele frequency distribution closer and closer to the modern average.

Note also that some amount of diversity in Adam is lost after several bottlenecks. The final curves have a significant number of alleles that are 100% A or 100% G, meaning that the initial A/G variation in Adam was lost. Population geneticists call this ‘fixation’, and this was a surprising result for me as I had not previously considered that some of the diversity of Adam could have been lost this way.
Is it fair to model successive population bottlenecks when the Bible says there was only one? Actually, yes, for the only thing of importance is the history of Noah and his family. My model assumes random mating, but this is contrary to human history and human nature. If there was any degree of inbreeding (due to geographic separation of the antediluvian population, fighting among clans, racism or family snobbery, etc., etc.), drift would have been likely to occur. Also, this is a model. The point is to show what is possible and compare it to what is likely, not to make an absolute statement about history. In the end, the results are quite friendly to the biblical account.
Additional HapMap analyses
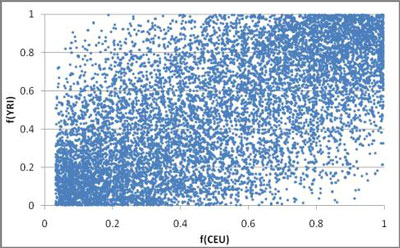
There are several other ways to analyze the HapMap data that might inform us about history. In Figure 13, I compare the allele frequencies of 10,000 randomly selected A/G variants within the CEU and YRI (individuals from the Yoruba tribe of Western Africa). Figure 14 shows the 95% confidence intervals of the same data. It is clear that these two populations came from the same source population, for the frequency of any allele in one population is a fair predictor of the frequency of that allele in the other. Also, the fact that each allele does not have the exact same frequency in both is testimony that genetic drift has occurred in the populations after they split, but also that not so much time has elapsed as to erase the commonality. Evolutionists accept this as well, many claiming the Out of Africa theory as an explanation. The multiple subpopulation bottlenecks that occurred when the clans were divided at the Tower of Babel event should be the creationist explanation.
One of the purposes of the HapMap project was to examine the history of chromosomal recombination in human history. The reason I started working on this data was to see how much of the original genomes of Adam and Eve could be seen in the modern genetic data. I have not yet gotten to this analysis, however. This will have to be the subject of further explorations. For now, we can be satisfied with several facts in our favor: 1) There are places in the human genome that have not recombined in all of human history. 2) There are not as many recombination blocks as predicted by evolutionary theory (this is one reason they have a bottleneck in Out of Africa scenarios). And 3) between two and four recombination blocks (e.g., the amount that could fit into Adam and Eve) can explain over 95% of the available block data. One thing in the evolutionists’ favor is their contention that the blocks found across the world are a mere subset of those found in sub-Saharan Africa, but this claim needs detailed examination.
Created diversity vs mutation
As detailed above, one of the arguments from BioLogos is that there has not been enough time to accumulate the mutations found among people today if we came from Adam and Eve. A corollary to that is, we could not survive that kind of mutation load. As I said above, however, this is assuming Adam had no heterozygosity, which is ridiculous. How much created diversity might we assume? One way of estimating this is to look at the number of alleles shared among all world populations. In the HapMap data, every single measured allele falls into this category. Each of these is also biallelic, that is, it has but two alternate letters (A or G, C or T, etc.). Part of this was by design as the HapMap alleles were carefully selected, but this is a good statement about the state of human genetic diversity in general: most variation is biallelic and can be found in most populations. Thus, well over one million heterozygous, biallelic loci must have been present at Babel. These also should have been present at the Flood and at Creation a mere ten generations prior to that. Yet, HapMap did not measure every allele. Since most of the genetic diversity known today can be found among multiple world populations, most of the variation should have been here from the beginning.

Is it possible for a single person to carry this much diversity? I ran an analysis of the HapMap data to measure the amount of heterozygosity within the HapMap individuals. Population-level differences were slight, with a global average of 4.33 ± 0.234 × 10⁵ (±SD) heterozygous alleles per person. Thus, approximately 30% of all HapMap alleles are heterozygous within each person. If there are 10 million common variants, a single individual would be expected to carry upwards of three or four million heterozygous alleles! Because most people are phenotypically normal, there is no reduction in fitness associated with these high levels of heterozygosity. Why should there be if most of this variation was created by God and engineered into the original genome? I expect Adam had about 10 million or more heterozygous loci and that each of his children had half that much.
Some alleles, however, have been added to the population through mutation. How much genetic diversity is due to mutation? Given the 10 million common variations in the human genome, there are many more ‘private’ and very rare variants that occur in one or a few individuals in specific populations. These should be mutations that have occurred since the Flood and Babel. With an average (modern) generation time of 30 years, there have only been about 150, perhaps as many 200, generations in all of human history. Assuming a conservative modern estimate of 100 new mutations per person per generation, that gives us between 15 and 20 thousand mutations per person. This is a huge number when added up across the world population, and most of these should be unique (perhaps even totaling more than the amount initially created). Yet, on the individual level, it might be expected that only a small fraction (less than 0.01%) of heterozygosity is due to mutation.
Conclusions
It is disingenuous for Biologos to claim no evidence for Adam and Eve for several reasons. First, their conclusions are based on evolutionary assumptions. One cannot legitimately claim something to be proven without testing the assumptions behind that claim. To do otherwise amounts to circular reasoning and question begging, and a rejection of any alternative theory following from this is thus reduced to nothing more than a straw man argument. Second, the majority of data fit nicely into the straightforward biblical model, including a single starting couple a mere 6,000 years ago. While there are several unresolved issues with the biblical model as it relates to the data at hand, the same can be said about every evolutionary model, so one cannot conclude that the Bible has been invalidated by the available evidence. Albert Einstein is rumored to have opined, “A thousand experiments cannot prove me right. A single experiment can prove me wrong.” This is sound logic. Francis Collins and BioLogos would do well to heed his advice.
References
- For example, see Is there enough time in the Bible to account for all the human genetic diversity? Return to text.
- Evolutionary syncretism: a critique of BioLogos. Return to text.
- CMI’s Statement of Faith. Return to text.
- See Lael Weinberger’s refutation, Harmony and discord, a review of The Language of God: A Scientist Presents Evidence for Belief by Francis S. Collins, J. Creation 21(1):33–37, 2007. Return to text.
- The Search for the Historical Adam, Christianity Today, pp. 23–24, June 2011. Return to text.
- Francis Collins speaking at the Christian Scholars’ Conference at Pepperdine University, 2011; see Noted scientist tackles question of religious faith, Malibu Times, 29 June 2011. Return to text.
- Haggerty, B.B., Evangelicals question the existence of Adam and Eve, NPR, 9 August 2011. Return to text.
- See interview with Lael Weinberger, Creation 33(1):16–18, 2011. Return to text.
- Haggerty, B.B., Evangelicals question the existence of Adam and Eve, NPR, 9 August 2011. Return to text.
- Dawkins, R., The God Delusion, p. 253, emphasis in original, 2006. See detailed critique. Return to text.
- Howard Condor interviewing Richard Dawkins on Revelation TV, Feb 2011; https://www.youtube.com/watch?v=Wfe4IUB9NTk. Return to text.
- Batten, D., Catchpoole, D., Wieland, C., Message Mania: Deciphering the human genome: what does it mean? Creation 23(3):16–19, 2001. Return to text.
- Astonishing DNA complexity update. Return to text.
- Biswas, C., Founder mutations: evidence for evolution? Journal of Creation 20(2):16–17, 2006. Return to text.
- Our chromosomes come in pairs, with one copy of each coming from our father and the other coming from our mother. Adam and Eve had no parents, but Collins sets up a straw man by apparently believing that Adam had identical chromosome pairs and, thus, no built-in variation. See Variation and natural selection versus evolution from Refuting Evolution. Return to text.
- HapMap.org Return to text.
- Note that there are 3 billion DNA letters in our genomes, with each of our hundred trillion cells (excluding red blood cells, which do not have nuclei) carrying two copies. Return to text.
- Purines are double-ringed nucleotides and pyrimidines are single-ringed nucleotides. A transition is a purine-purine or pyrimidine-pyrimidine swap. It is easier to get a transition than a transversion, which would involve a purine-pyrimidine swap. Return to text.
- One must carefully consider the ‘sphere of prediction’ inherent in any model or hypothesis. Different models incorporate different constraints and different specific predictions can be drawn from them. For example, the biblical model necessitates a genetic bottleneck associated with Noah’s Flood. Evidence for a genetic bottleneck has been found. The result is that evolutionists added this bottleneck to the Out of Africa hypothesis, even though there was no specific prediction that called for such a bottleneck. It is consistent with the theory even though not predicted from it. Likewise with the HapMap allele data from Figure 1, Creation makes no specific prediction in this case. Return to text.
- Duke of Argyll, A Great Lesson, The Nineteenth Century 22:308, September 1887. Return to text.
- See also Corals, genes and creation: Jonathan Sarfati chats with CMI’s marine biologist and geneticist Dr Robert Carter, Creation 33(1):53–55, 2010. Return to text.
- Mutation-drift equilibrium is that theoretical point at which mutations are entering the population at the same rate at which they are being removed by genetic drift. Return to text.
- Sanford, J., et al., Mendel’s Accountant: A biologically realistic forward-time population genetics program. SCPE 8(2):147–165, 2007; https://mendelsaccountant.info/. Return to text.
- Theological support for the clone theory is that the Bible attributes the Fall to Adam (Romans 5, 1 Corinthians 15), and our redemption to Jesus as “kinsman-redeemer” (Isaiah 59:20), who by definition is related by blood to those whom he redeems. I.e., all Adam’s descendants are affected by the Fall, but all are capable of redemption because Jesus, “the last Adam” (1 Corinthians 15:46) is also a descendant of Adam (Luke 3), thus our blood relative. But if Eve were genetically different, would she really be related to either the first or the last Adams? CMI is not dogmatic on this however. Return to text.
- The interested student might notice that these curves follow Pascal’s Triangle, level = n * 2 + 1. For a single individual, the ratio is 1:2:1 (level 3). For two individuals, the ratio is 1:4:6:4:1 (level 5). Etc. Return to text.
- With only the ‘X’ chromosome of Adam’s X-Y (male) pair duplicated to result in an X-X (female) pair in Eve. Return to text.


Readers’ comments
Comments are automatically closed 14 days after publication.