

Journal of Creation 37(1):62–72, April 2023
Browse our latest digital issue Subscribe
Racemization of amino acids under natural conditions: part 5—exaggerated old age dates
Amino acid racemization has been used for dating purposes. Many environmental factors can be used to support or discredit ages consistent with presuppositions, including temperature, pH, degree and timing of mineralization, accelerated racemization of hydrolyzed peptide fragments, degradation of collagen, preferential leaching or retention of high D/L fractions, and contamination with L-amino acids from the environment. Putative older samples consistently fail to produce the high D/L ratios expected by old-earth paleontologists, and lower racemization rate constants are assumed instead of challenging the assumed dates. We show that dates based on proportion of amino acid racemization can be reliably recalibrated to predict dates which do not exceed the age of the Genesis Flood.
Rates of racemization in fossilized samples
In parts 1–4 of this series, we showed that large peptides consisting of almost only L-amino-acid (L-AA) residues will not form under plausible aqueous conditions.1-4 Now we will address another naturalist challenge to belief in a young creation. D/L AA enantiomeric ratios have been claimed to show various organisms died tens of thousands to millions of years ago. Evolutionists often claim that dating methods produce very similar results, often demonstrating ages beyond ten thousand years. We will examine two representative cases involving dating of human bones and fossil mollusks. The intention here is not to provide an extensive review of the dating applications based on AA racemization but to elucidate key recurring principles which can be applied to other dating studies.
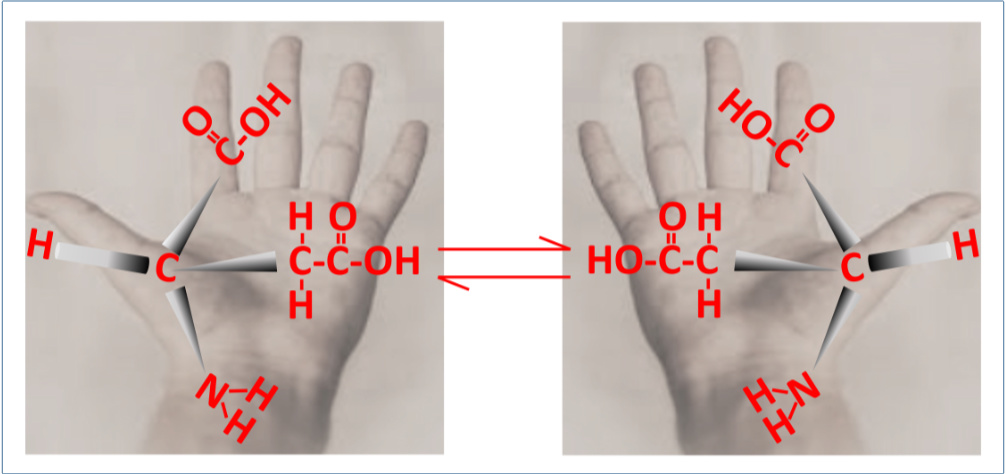
Aspartic acid (Asp) is the most often used AA for racemization dating, see figure 1.
Once the date and D/L-Asp ratio are known for one sample, presumably this information can be used to date other samples after determining their D/L-Asp values. This assumption neglects much of the underlying chemistry occurring. The rate of increase of D-Asp is not linear when plotted against other AAs such as alanine, displaying a rapid initial phase in heated collagen.5,6 Smith and Evans have suggested that the slower-rate region reflects increasing proportion of free Asp due to hydrolysis of peptide bonds with time, since free AAs racemize more slowly than residues at the end of peptides.7
Goodfriend demonstrated that Asp also arises from deamination of asparagine (Asn), providing an additional pathway to generate L-Asp.8 Asx is commonly used to represent the measured concentration of Asp when it includes contribution from Asn → Asp. Goodfriend also suggested that the complex pattern of Asx racemization may be due to differences in the rate of an intermediate cyclic succinimide (Asu) which can racemize rapidly.8 Forming Asu introduces considerable strain on the surrounding peptide backbone and will therefore be strongly affected by temperature.9,10
Discrediting unexpected ages in the distant past can be done by claiming that some factor or other diverged between the calibrating sample vs the one to be dated.
Increases in D-Asp are used in forensic sciences for estimating age at death back to relatively recent times, but this will not be discussed further here.11
If the age is believed to be known, some scientists believe information can be obtained about average paleotemperatures by calculating a racemization rate constant, but this can lead to evolutionary circular reasoning by confusing measurable facts with calibrated dates.12,13
Part 1. Old ages reported for bone samples
We will discuss next a well-known controversy among paleontologists involving significantly discordant dates reported for several Californian Paleoindian skeletons. This provides valuable insights into how paleontological dating works in practice, and principles to reflect upon in our creation vs evolution discussions.
When an organism dies, the proteins first hydrolyze at labile peptide bonds such as for serine and aspartic acid residues. The resulting peptide fragments continue to hydrolyze, leading eventually to free amino acids. Bada et al. have developed a dating method based on the amount of Asp racemization found in bones, calibrated using samples assumed to have been subject to similar conditions, which were dated using 14C. Under conditions of extreme desiccation, racemization could be much slower even at high temperature.14 However, bones generally contain enough water that this is not an important factor.15
It is common to use surrogate laboratory methods which are cheaper, faster, easier to perform, or require less sample material. Bada’s procedure offered the advantages of not having to calculate racemization rate constants for multiple fluctuating temperatures; being able to use much smaller test samples; and being applicable to dates older than 14C could reliably determine. This is because in bone at 20°C the half-life for Asp racemization has been estimated to be ~15,000 years, whereas that of 14C is ~5,700 years.16
The principle is to radiocarbon date a fossil sample and measure its D/L. The D/L of other bones from the general area are then used to estimate their ages, assuming exposure to similar environmental factors, especially temperatures.16
The procedure was applied in 1974 and 1975 to several North American Paleoindian skeletons, with ages reported to be 40,000–60,000 years.15,17 Bada et al. claimed these results were in close agreement with radiocarbon ages18-20 and that “the results of which provide additional evidence that man was present in North America more than 40,000 years ago.”16 Additional evidence? Such statements from a 32-year-old associate professor did not sit well with the established paleontologists convinced that humans had migrated into the Americas about 13,000 years ago. A lively debate drew in many participants, leading to deep skepticism on the validity of the racemization method in toto.21 Much was at stake: reputations, whose proposals get funded, who attracts the brightest graduate students, and career prospects.
Bada and allies forcefully defended their position, denying charges of non-reproducible results and adding evidence to show that a coherent evolutionary picture resulted. For example, racemization analyses of Upper Pleistocene-age horse bones collected from near the Del Mar19 and Sunnyvale22 Paleoindian sites were offered to support the claim the human skeletons were Upper Pleistocene in age.
Studies by another research team using the uranium decay series method on the Del Mar and Sunnyvale skeletons led to radiometric ages four to five times younger than the estimated aspartic acid racemization ages had.23 However, Bada et al. claimed that U-series ages always tend to be younger by as much as two to three times than the actual burial ages of Upper Pleistocene fossil bones.15,24,25 Notice how easily ages which contradict ‘known’ dates get discarded, whereas those calibrated to give ‘good’ results are retained.
A new radiocarbon dating technique utilizing accelerator mass spectrometry (AMS) applied to several of the disputed Paleoindian skeletons produced dates about ten times lower.15 This was a stunning development, implying much faster L ⇌ D interconversion rate constants, k, for Asp. Can experts simply change laboratory results like rate constants by about an order of magnitude? If other evolutionists had not had a personal stake in defending their publications the former ~60k dates would have continued to be among the ‘scientific facts’ disproving a recent creation. And we will propose that the new rate constants for Paleoindian skeletons are probably still too low!
Critical evaluation of the dating of bones
Thanks to the efforts of highly motivated opponents, many chemical facts were brought to light which would have been neglected had the simplistic original assumptions remained unchallenged. It has been observed that samples having less amino acid content seem to correlate with higher k-interconversion Asp values. Perhaps as collagen breaks down through peptide bond hydrolysis ever more aspartic acid residues end at the N-terminal position of peptide fragments where racemization is fastest (i.e. higher k values).26,27 Leaching of some fragments and free AA would lead to less total AA content in those samples.
Considerable differences were found in the extent of collagen preservation in Californian Paleoindian skeletons thought to be of similar ages. Plausible causes proposed include leaching by groundwaters, and/or heating effects resulting from either shallow burial depths or cultural burial practices.15 Also, many of these skeletons come from coastal ecological environments where carbonates may have accelerated the rate of collagen hydrolysis.28 The strongly argued claim that k values would be very similar for nearby organic remains has been thoroughly discredited.
Insights from bone studies on samples from Tanzania
In fossil carbonates, the most highly racemized components are free amino acids, which could have arisen from internal aminolysis followed by hydrolysis in bones.29,30 These soluble AAs could be preferentially leached out, especially in the case of bone samples. Studies using bones from the Olduvai Gorge (in Tanzania) indicated that samples from the famous Nasera rock shelter (2,180 years old, k = 6.7 × 10⁻⁵ for Asp) are much more extensively leached than samples from the nearby Olduvai excavations (1,360 years old, k = 7.4 × 10⁻⁵ for Asp).15 Nevertheless, the calculated k values for Asp were about the same, contra the expectation that hydrolysis and subsequent leaching would significantly lower the average D/L ratios in the samples measured.
Studies from the Nasera excavations showed the D/L-Asp ratio remained at ~0.5, starting from ~2 m throughout the remaining lower sections (~4–5 m).15 Samples from level 3A were claimed to be 2,180 years old (k = 6.7 × 10⁻⁵) and from level 5A 21,600 years old (k = 1.8 × 10⁻⁵). 15 A sample from the Naisuisui Beds was claimed to be 17,500 years old (k = 1.5 × 10⁻⁵).15 We recognize the familiar pattern of putatively older samples being assigned considerably lower average k values, instead of using the D/L values plus calibration sample to shorten the putative ages. As another example, a sample from the Upper Ndutu Beds with an aspartic acid age calculated to be 33,000 years was dated using 14C to be only 3,340 ± 800 years old.15
After about 80,000 years the fossil bones from the Olduvai Gorge region should have D/L aspartic acid ~1.0. However, a fossil bone from the Masek Beds, with dates ranging from ~450,000 to 600,000 years, had a D/L Asp ratio of ~0.75. Samples from other older stratigraphic levels showed even lower D/L ratios.15 These results could be interpreted as having been contaminated by aspartic acid from surroundings, or of course that they are of similar ages.
Many discrepancies with radiocarbon dates
Using racemization of Asp to date samples more than a few hundred years old often yields discordant results. A living anemone, Gerardia, was dated as being 1,800 years old by 14C but only 250 years by extrapolation from high temperature Asx experiments.31,32
A mean D/L Asp ratio of only 0.084 from an insoluble fraction was reported for a putatively 20,000-year-old bone from the Taishaku Konondo Cave Site in Japan. This was surprising, especially since the average temperature was believed to have been 19°C, so racemization should have been fairly rapid.33
Experiments suggest that Asx in rat dentine appears to racemize ten times faster than human dentine.34 Perhaps the variability among human teeth remains is also considerable. Furthermore, rates vary with what portion of the dentine material is measured. Many studies of dentine proteins found a much faster rate of racemization in the soluble protein fraction.35,36 Soluble proteins contribute to the increase in D-Asx seen in dentine with time, but countering this, water-soluble materials are more easily leached out.
In samples of historical ages, the D-Asx concentrations in dentine collagen all tend towards a consensus value, independent of age, over periods of mere decades to centuries.12,37-39 This has been interpreted as due to loss of faster racemizing soluble proteins and contribution of fully racemized Asp deriving from the ~10% non-collagenous proteins (NCPs) present in bone and teeth.12
Temperature fluctuations and degree of mineralization are critically important. AA racemization is unlikely to occur in triple helical collagen below its denaturation temperature (Tm). The Tm is quite high for demineralized collagen (~68°C), and very high for mineralized collagen (~150°C). These facts should create deep skepticism about very ancient dates assigned to bone or tooth samples, based on measured Asp D/L values.
Looking deeper into racemization of aspartic acid
Investigations now report that a particular calibration constant should only be used to date other fossil bones having amino acid content very similar to that of the calibration samples.40,41 Asp racemization is affected by other AAs present.
Can a fixed k be assumed for thousands or tens of thousands of years? Young-earth scientists believe oceans and coastal regions after the Flood and through the Ice Age (~2,300–1,800 BC) were much warmer. Suppose a much younger desiccated sample from a dry and cool period or location is used for calibration purposes. A time, t, is assigned from radiocarbon dating, which, with a measured D/L value, leads to a value for k, calculated using [1]. In [1], the t0 term corrects for D-Asp already present when the organism died or was introduced during laboratory processing:42
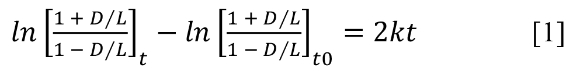
A new sample is now to be dated which had been exposed to decades or hundreds of years of a much warmer and humid prior environment, perhaps also with soluble basic racemizing minerals present. Due to the much higher k value, this automatically results in a high D/L ratio, so that extrapolating with the k value from the non-representative calibration sample predicts ages which are too old.
To illustrate the effect of temperature on k, suppose that shortly after the Genesis Flood on the California shoreline when an individual was buried the effective temperature was 30°C. A few hundred years later assume the effective temperature was 15°C when the calibrating sample was collected.43 An ‘effective temperature’ difference of 15°C could result from a much smaller ‘average temperature’ difference than 15°C.43 From the Arrhenius equation [2] we find the difference in ln(k) leading to expression [4],
lnk = Ae-Ea/RT [2]


We use Ea = 38 kcal/mol for Asp in bone, and R = 1.9872 cal/K•mol, which leads to k1/k2 = 26 for the 15°C difference.44 With much higher moisture and possibly catalyzing metal cations like Cu2+ in the post-Flood costal environment, the L → D rate constant might have even been up to ~100 times higher than presumed using the calibrating sample. Thousands of years would not be necessary to obtain a large difference in D/L between both specimens.
We collected data reported using only AMS for dating to determine if there was the expected strong correlation between reported ages and D/L values, and the resulting k values (see table 1). In all cases low measurement error values were claimed.
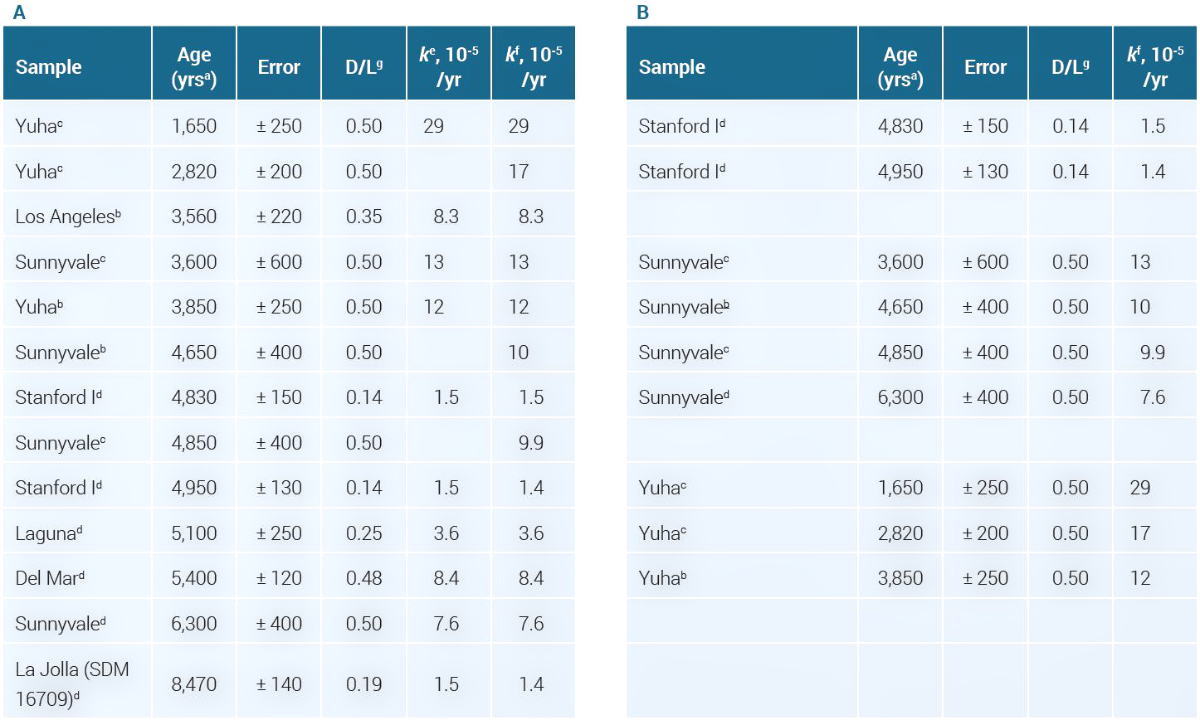
b Radiocarbon age of the HCl-insoluble organic fraction.
c Radiocarbon age of the HCI- or NaOH-soluble organic fraction.
d Radiocarbon age of the total amino acid fraction.
e Reported in ref. 15.
f Our calculations, using k = ½t × (ln((1 + D/L)/(1 – D/L))t – ln((1 + D/L)/(1 – D/L))t0), where ln(1 + D/L)/(1 – D/L)t0 = 0.1402 based on an assumed D/L = 0.07.
g The samples were all hydrolyzed for 24 hr; thus the D/L for t = 0 value was set to 0.07 for these experiments.
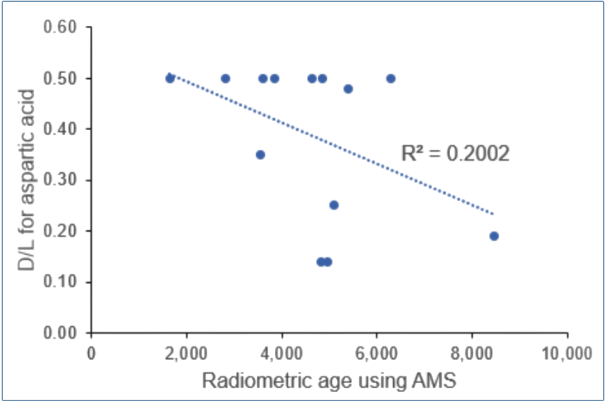
From table 1 we see that the youngest age now being reported is 1,650 ± 250 years with a high D/L = 0.50, whereas the oldest age is 8,470 ± 140 years and D/L = 0.19. This is the opposite of what this dating methodology demanded. Figure 2 confirms that the D/L values are not consistent with the claimed ages.
We distrust the dates calculated. From table 1B, for the Sunnyvale specimen, D/L = 0.5 was always used to calculate the k values, whereas the radiometric ages ranged from 3,600 to 6,300 years. Different organic fractions were used for the AMS measurements, but this should not affect the radiocarbon outcomes. Surprisingly, D/L values were apparently not determined for the alternative organic fractions. For the Yuha specimen, D/L = 0.5 was also reported, with AMS-based dates between 1,650 and 3,850 years. Of the 13 entries in table 1A all but four were reported to have a D/L = 0.48–0.50, despite very different ages.
Using a calibration curve to force AMS and racemization dates to agree
Figure 3A shows how the calculated k values range from 1.5 × 10⁻⁵ to 29 × 10–5 despite an assumed constant environment.
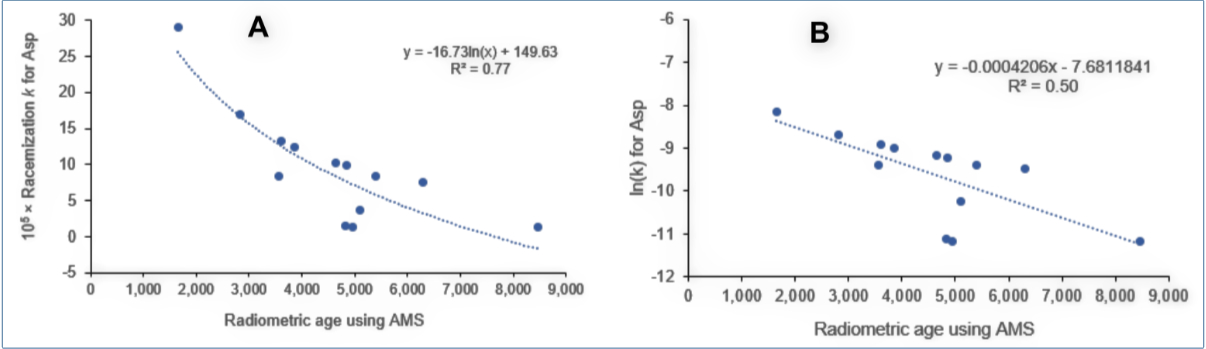
The claim that D/L ratios are reliable indicators of age is incorrect. The allegedly oldest specimen (La Jolla, 8,470 yrs) displayed very little racemization (uncorrected D/L = 0.19, of which 0.07 is assumed to have been present initially!).
Recall that over time proteins would hydrolyze to peptide fragments, leading to ever more aspartic acid residues at an N-residue position, which racemize the fastest. k values should accelerate for older samples. However, on average, lower k values are reported for older putative ages, which I have not found pointed out anywhere in the literature. This is remarkable, having seen that three highly reproducible radiocarbon dating methods with insignificant relative errors produced very discordant ages for the same samples.
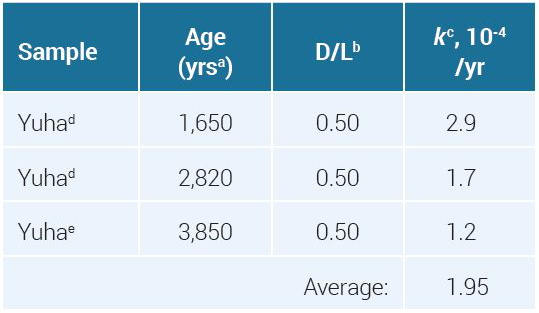
Perhaps we could recalibrate the data to produce useful results. We selected a sample having several measurements, a high D/L value (so that the relative error is small), and an AMS date younger than the Flood to minimize opportunities for periods of abnormally high temperature and moisture. The best candidate is the Yuha specimen, and we will use the average value for k. This date would also alleviate concerns of accelerated radioactive decay effects during the Flood period, as proposed by the RATE project, which could invalidate the AMS results.45 In the next sections we will examine the relationship between D/L, k, and ages, so we need to first provide a mathematical basis.
Using rate constants to predict time to achieve D/L values
Amino acid racemization almost always occurs with the same rate constant, k, in the forward and reverse direction
L ⇌ D. [5]
When an organism dies, its proteins will possess almost only L-AAs. Under unchanged conditions of temperature, pH, and so on, there is a simple mathematical relationship between D/L ratio and the rate constant for most AAs46
where t is the time AA interconversion occurred.
Let us assume that when the organism died at time t0, D/L = 0. We divide time into short slices and abbreviate [L]time = t as Lt. A bootstrap sequence of events allows us to calculate Lt at the end of each time slice as the sum of Lt–1 at the beginning of the interval, minus the amount which converted to D, plus the initial amount of D present at that time slice which converted to L
Lt = Lt–1 – kLt–1 + kDt–1 [7]
Dt = 1 – Lt. [8]
For a sequence of short time intervals this works very well. During each time interval some of the L → D produced will revert, L ← D contributing k(kLt–1) to L. Of this small quantity, k(k2Lt–1) would be lost back to D, and so on, equilibrating back and forth. As the number of refining corrections increases the system converges to [9], derived in the Appendix
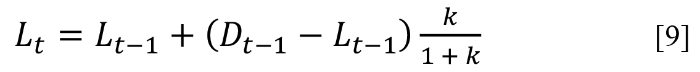
which for k << 1 reduces to [7].
We could also use the relationship used in part 2 to find the concentration of L at the end of any time interval, t, using equation [10]
Lt = ½(1 + e–2kt), [10]
derived after algebraic manipulations from ln(L0/(2Lt – L0)) = 2kt, where L0 = 1 at time = 0, and Dt = 1 – Lt.44
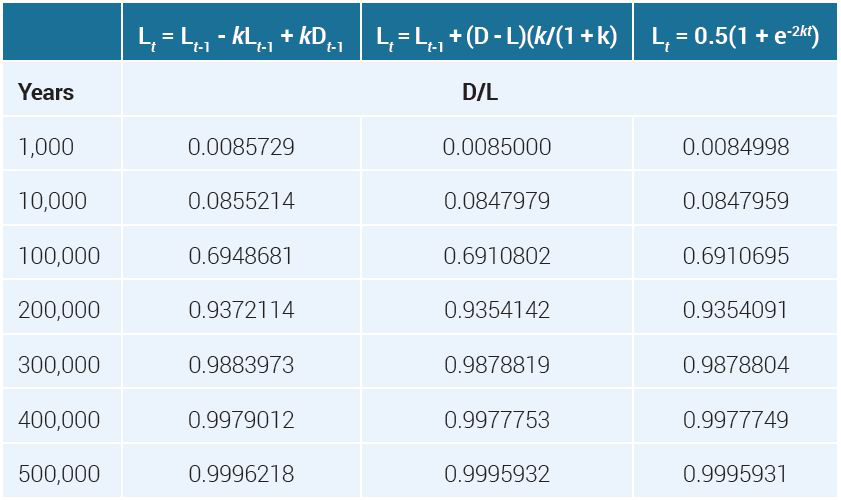
We confirmed that D/L ratios calculated via [9] and [10] are virtually indistinguishable using Microsoft Excel, even for a relatively large value of k, starting at t = 0 out to t = 500,000 years, using time intervals of 1,000 years for each step. The D/L ratios found using the simple approximation [7] with [8] were also in close agreement. Some values are shown in table 2 at a few time durations.
b Ref. 48.
Equations [7] and [8] are an approximation and, although not as precise as the other two algorithms, predict D/L values well within the variability of the data reported (see table 4, below). I chose this method to predict D/L values in this paper, being easiest to communicate the concept, namely that initially pure L-AAs in the fossil samples would equilibrate L ⇌ D over time, and we wish to determine if one value for k could fit all the data points reasonably.
Predicted ages using the most plausible racemization rate constant
Bada and his colleagues use D/L = 0.07 in the ln[(1 + D/L)/(1 – D/L)]t = 0 term in Eq. [1], obtained from the Asp enantiomeric ratio determined using a modern bovine bone carried through the same analytical steps as the fossil bones.49 This leads to a correction value of 0.1402. We have doubts about the correctness of using this factor for all samples.50-52 Fujii et al. pointed out that some protein positions rapidly accumulate D-Asp residues as organisms age.53 Why should the initial D/L be identical for all human samples? The D/L ratio in bones are believed to correlate strongly with the ratio of non-helical to triple helical collagen. Initially the D/L ratio will trend towards a value of 0.09, due to complete racemization of the non-helical telopeptides.12
b Hydrolyzed for 24 hrs.
c Using k = ½t × ln((1 + D/L)/(1 – D/L)) – 0.1402.
d Radiocarbon age of the HCI- or NaOH-soluble organic fraction.
e Radiocarbon age of the HCl-insoluble organic fraction.
Nevertheless, to ensure consistency with reported data we will assume that at time t = 0, D/L = 7.00% (L = 93.46%, D = 6.54%). This shortens the time necessary to achieve a measured D/L. We used the three AMS ages for Yuha from table 1 with the ln[(1 + D/L)/(1 – D/L)]t = 0 correction to calculate an average k value (see table 3).
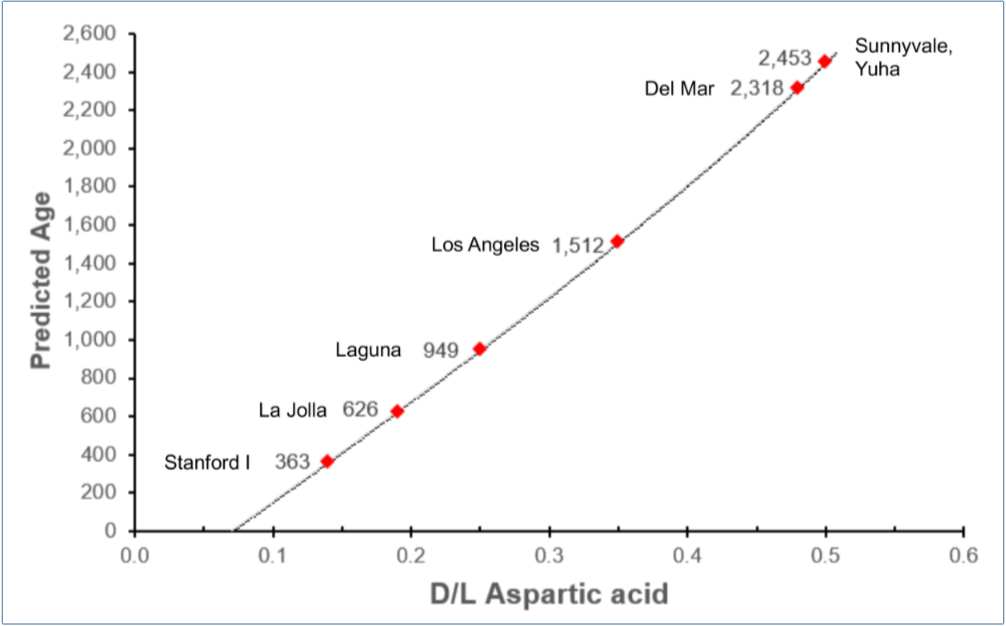
We used k = 1.95 × 10⁻⁴ /year and the measured D/L values (from table 1) to calculate new, calibrated ages for the other Paleoindian samples as shown in figure 4. If the new calibrated dates are correct, then most of these American Indians lived in the Christian era.
Part 2. Old ages for mollusk shells
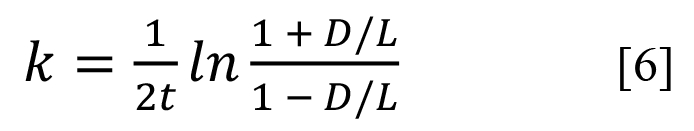
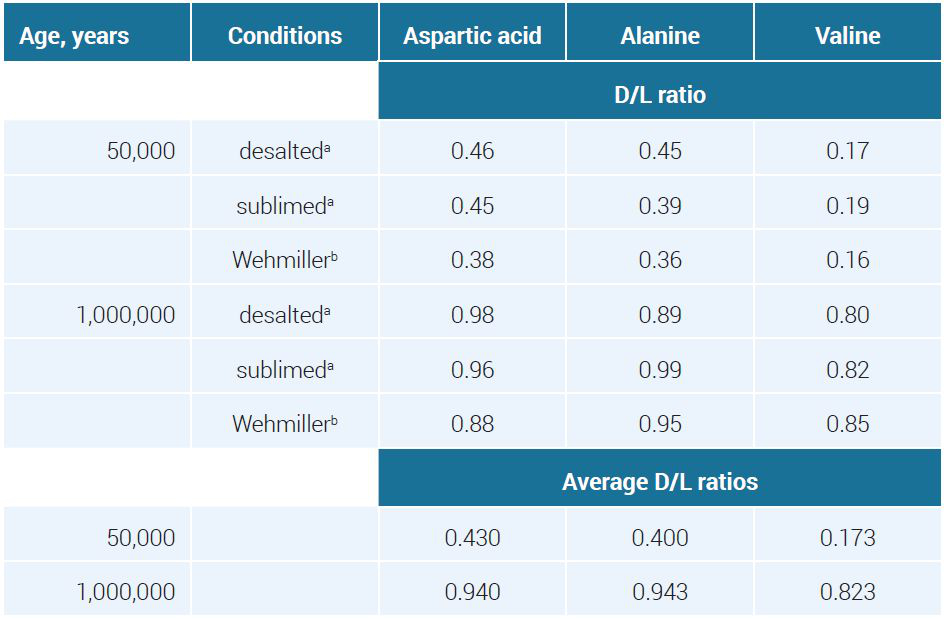
In one study, Glavin and Bada examined two fossil Pleistocene mollusk shell samples with assumed ages of 50 ka and 1 Ma to validate a new analytical method.47 This is an example of confusing empirical data with evolution-based date presuppositions. D/L ratios were reported using three sample preparation methods to extract aspartic acid, alanine, and valine (see table 4).
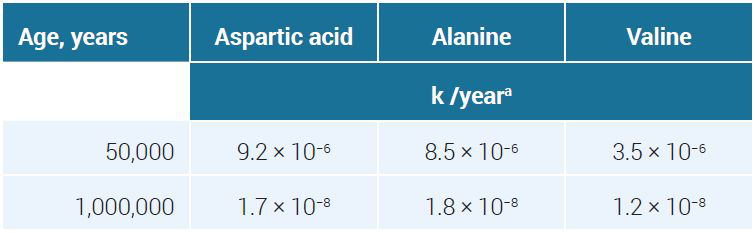
Applying equation [6] to the average D/L ratios in table 4 led to a k for the alleged 50-k-old fossil about 400 times higher than for the putative 1-million-year-old one (see table 5).
These k values are about one to three orders of magnitude lower than reported for AAs by Steen et al. using sedimentary material.54 Fossilization likely slows down AA residue interconversion through strong binding to various minerals and presence of less water, but a researcher cannot know when or how much fossilization had occurred. The higher D/L ratio in the allegedly older sample might have resulted from exposure to periods of higher temperature preceding fossilization.
Goodfriend and others proposed using empirical power-function transformations of the D/L data for both mollusk and ostrich shells.55,56 Different power-functions were necessary for different taxa, which still failed to produce good results over the full range of values.56
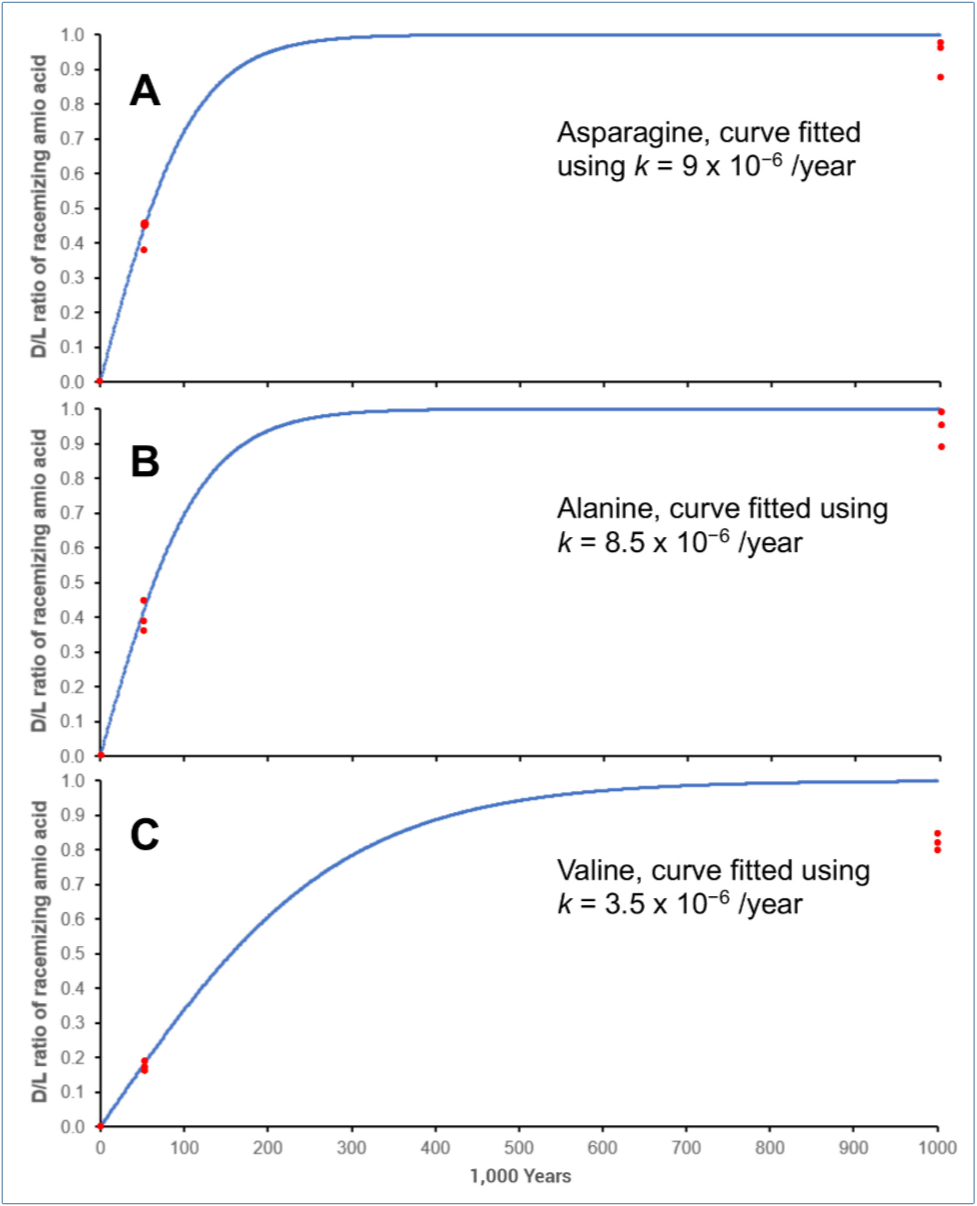
We can find the best value for k assuming similar environmental factors, and that the major process is simple L ⇌ D interconversion, beginning with t = 0 at D/L = 0. We tested different values for k by trial and error using equations [7] and [8], using 1,000-year intervals over a million years. A single rate constant cannot fit the clusters at time = 0, 50 k, and 1 million-years (see figure 5 for the best results).
Perhaps racemization slows down with degree of fossilization but by how much and when would be unknown. More accurate dates are unknowable without a complex, valid fossilization model.
Correcting for error in assumed ages
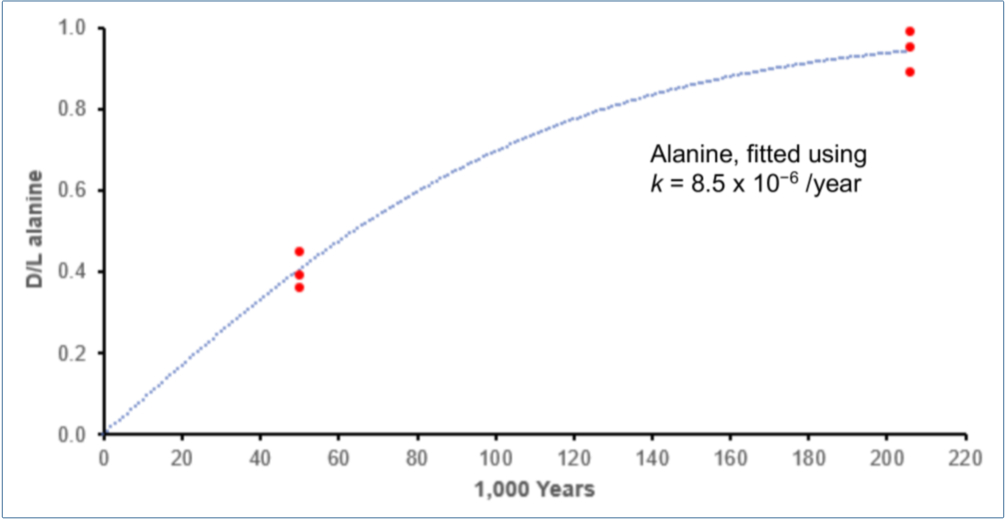
The D/L values for the three curves in figure 5 were carefully measured repeatedly, whereas the dates are heavily burdened by assumptions. Clearly the D/L values predicted by extrapolation to 1 million years are too high. An obvious hypothesis would be that the assumed dates are far too large. A rough visual inspection of figure 5 suggests that decreasing the million years by about a factor of five would lead to far better results. To illustrate, we repeated the bootstrap calculations used to produce figure 5B with an age far less than one million years (see figure 6).
The value of k ≈ 8.5 × 10⁻⁶ for alanine is suspiciously low, considering that Steen reported k = 4.8 × 10⁻⁵ /year for sedimentary material 3.4 m under the seafloor at an average temperature of 3°C.54 A much larger k for the Pleistocene samples would imply that the 50 k age is also seriously inflated.
Dating taking the Genesis Flood into account
Let us assume these Pleistocene fossils resulted from sedimentary burial during the Flood or its aftereffects. Much higher coastal temperatures would have been caused by processes such as rapid tectonic subduction, volcanos, and meteorite crashes. Temperature and pH differences, even for relatively short time periods, have a large effect on racemization.54
We used k = 0.0116 /year for alanine measured at 49.5°C (the lowest temperature having a reported k) for sedimentary material collected 3.4 m under the seafloor, using the bootstrap algorithm [7] and [8] to predict time to produce the fossilized D/L values.54 49.5°C might seem high, but this would be the effective and not average temperature. The temperature could also have been much lower, with k remaining comparably high due to dissolved minerals like Cu2+ and high pH.
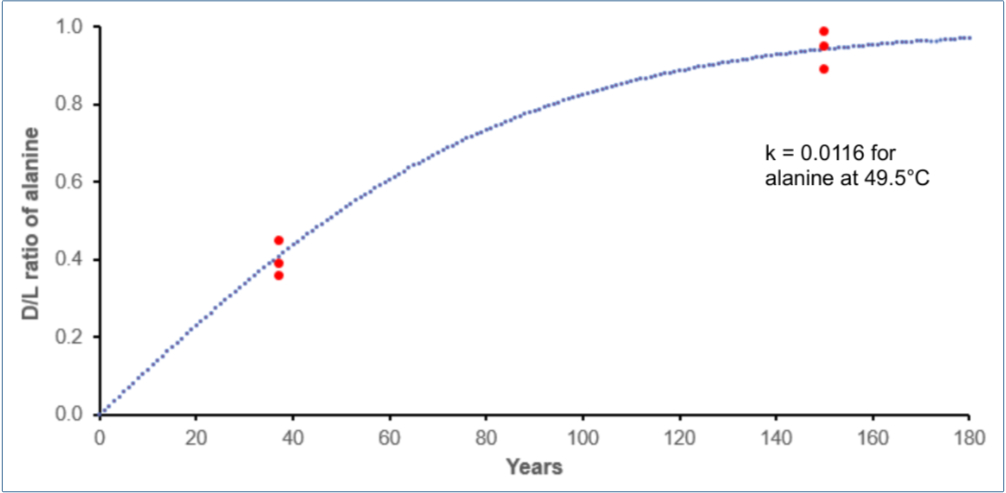
According to figure 7, only about 150 years might have been necessary for the Pleistocene fossils to attain a D/L = 0.95 for alanine and not a million years. Furthermore, racemization for Asp using the same sedimentary material at 49.4°C was almost five times faster (k = 0.053 /year).54 Many alternative scenarios could be conceived. Rapid racemization in a semi-mineralized humid state and lower effective temperatures could also have occurred during the ~500-year Ice Age during which warmer coastlines existed.
Large differences in the specific environments could be responsible for the differences in D/L values and not large differences in burial ages. We see how important researcher assumptions are.
Concluding remarks
Like all dating methods, which require enormous extrapolation into deep time, numerous factors could be used post facto to explain or discredit age predictions. These explanations are conceptual and rarely possible to quantity.
Suppose one wishes to assign higher average k values to older samples. The researcher could argue that greater protein hydrolysis over time would generate more peptide fragments. This would increase the proportion of Asp located at end positions which interconvert faster at the flexible frayed ends. Presumably, these free AAs with high D/L proportion would remain trapped to a large extent in the fossil. In addition, more of the stable collagen triple helix would denature with time, accelerating hydrolysis.57
Alternatively, suppose one wishes to assign lower average k values to older samples. Now one could argue that on average the sample has been longer in a fossilized state, which hinders racemization. (However, someone could also argue for the opposite effect: being loosely compacted longer with various minerals might accelerate racemization by facilitating extraction of the α-proton.) In addition, more time would produce ever more free AAs or small, soluble peptides through hydrolysis. These would be responsible for most of the higher D/L proportion, but now it is argued that, being soluble, they leach out, leaving an excess of non-racemized collagen behind.58,59
Note that reasons for ‘anomalous’ dates of k values could be applied to either the calibrating sample or the one of interest. Once a plausible narrative has been reasoned out amenable to the researcher’s presuppositions, it is often easy to believe one’s own explanations.
I agree with Collins’ assessment that
“Despite the large number of experiments which have been conducted to derive kinetic parameters for Asx racemization, when applied to fossil material the pattern and rates are unpredictable.”12
Appendix—Derivation of equation [9]
We wish to find a general mathematical expression for the concentration of an L-enantiomer AA during any time interval. This would permit us to use a bootstrap method to calculate L and D/L values over time.
Define Lt = concentration of L at the end of period slot t
Lt(initial) = Lt–1. [11]
During a time slot, L ⇌ D occurs with rate k in both directions:
kLt–1 → D [12]
kDt–1 → L. [13]
A fraction of the enantiomers just produced can revert:
k(kLt–1) → L [14]
k(kDt–1) → D. [15]
Of these reverted enantiomers, some can interconvert
k(k(kLt–1)) → D [16]
k(k(kDt–1)) → L. [17]
Combining terms
Lt = Lt–1 + Lt–1(–k + k2 – k3 + k4 …) + Dt–1(k – k2 + k3 – k4 …) [18]
Lt = Lt–1 + (Lt–1 – Dt–1) (–k + k2 – k3 + k4 …) [19]
For k < 1 the series (–k + k2 – k3 + k4 …) has a well-known solution. Set z = –k and note that zn+1 → 0 for small values of k.


References and notes
- Truman, R., Racemization of amino acids under natural conditions: part 1—a challenge to abiogenesis, J. Creation 36(1):114–121, 2022. Return to text.
- Truman, R., Racemization of amino acids under natural conditions: part 2—kinetic and thermodynamic data, J. Creation 36(2):72–80, 2022. Return to text.
- Truman, R., Racemization of amino acids under natural conditions: part 3—condensation to form oligopeptides, J. Creation 36(2):81–89, 2022. Return to text.
- Truman, R., Racemization of amino acids under natural conditions: part 4—racemization always exceeds the rate of peptide elongation in aqueous solution, J. Creation 36(3):74–81, 2022. Return to text.
- Goodfriend, G.A. and Meyer, V.R., A comparative study of the kinetics of amino-acid racemization epimerization in fossil and modern mollusk shells, Geochim. Cosmochim, Acta 55:3355–3367, 1991. Return to text.
- When using the protein collagen (the major component of bone and teeth) for dating, racemization rate constants cannot be extrapolated from high temperature measurements at which the highly stable triple α–helix structures will denature. Denaturation, especially when partially mineralized, would facilitate L → D interconversion only at higher temperatures. Return to text.
- Smith, G.G. and Evans, R.C., The effect of structure and conditions on the rate of racemization of free and bound amino acids; in: Hare, P.E., Hoering, T.C., and King, K. Jr (Eds.), Biogeochemistry of Amino Acids, Wiley, New York/Toronto, pp. 257–282, 1980. Return to text.
- Goodfriend, G.A., Patterns of racemization and epimerization of amino acids in land snail shells over the course of the Holocene, Geochim. Cosmochim. Acta 55:293–302, 1991. Return to text.
- Kossiakoff, A.A., Tertiary structure is a principal determinant to protein deamidation, Science 240:191–194, 1988. Return to text.
- Stevenson, C.L., Friedman, A.R., Kubiak,T.M., Donlan,M.E., and Borchardt, R.T., Effect of secondary structure on the rate of deamidation of several growth hormone releasing factor analogues, Int. J. Peptide Prot. Res. 42:497–503, 1993. Return to text.
- Ritz, S. and Schutz, H.W., Aspartic acid racemization in intervertebral disks as an aid to postmortem estimation of age at death, J. Forensic Sci. 38:633–640, 1993. Return to text.
- Collins, M.J., Waite, E.R., and van Duin, A.C.T., Predicting protein decomposition: the case of aspartic-acid racemization kinetics, Phil. Trans. R. Soc. Lond. B 354:51–64, 1999. Return to text.
- Miller, G.H., Magee, J.W., and Jull, A.J.T., Low-latitude glacial cooling in the Southern Hemisphere from amino-acid racemization in emu eggshells, Nature 385:241–244, 1997. Return to text.
- Hare, P.E., Amino acid dating of bone—the influence of water, Carnegie Inst. Washington Yearb. 73:576–581, 1974. Return to text.
- Bada, J.L., Amino acid racemization dating of fossil bones, Ann. Rev. Earth Planet. Sci. 1:241–268, 1985. Return to text.
- Bada, J.L. and Helfman, P.M., Amino acid racemization dating of fossil bones, World Archaeology 7(2):160–173, 1975. Return to text.
- Bada, J.L., Schroeder, R.A., and Carter, G., New evidence for the antiquity of man in North America deduced from aspartic acid racemization, Science 184:791–793, 1974. Return to text.
- Ike, D., Bada, J.L., Masters, P.M., Kennedy, G., and Vogel, J.D., Aspartic acid racemization and radiocarbon dating of an early milling stone horizon burial in California, Am. Antiq. 44:524–530, 1979. Return to text.
- Bada, J.L., Masters, P.M., Hoopes, E., and Darling, D., The dating of fossil bones using amino acid racemization; in; Berger, R. and Suess, H. (Eds.), Radiocarbon Dating, Univ. Calif. Press, Los Angeles/Berkeley, pp. 740–756, 1979. Return to text.
- Skelton, R.R., Amino acid racemization dating: a test of its reliability for North American archaeology, Ph.D. thesis, Univ. Calif., Davis, p. 343, 1983. Return to text.
- Gerow, B.A., Amino acid dating and early man in the new world: a rebuttal, Soc. Calif. Archeol. Occas. Pap. Method Theory 3:1–12, 1981. Return to text.
- Lajoie, K.R., Peterson, E., and Gerow, B.A., Amino acid bone dating: a feasibility study, southern San Francisco Bay region, California; in: Hare, P.E., Hoering, T.C, King, K. Jr (Eds.), Biogeochemistry of the Amino Acids, Wiley, New York/Toronto, p. 558, 1980. Return to text.
- Bischoff, J.L. and Rosenbauer, R.J., Uranium series dating of human skeletal remains from the Del Mar and Sunnyvale sites, California, Science 213:1003–1005, 1981. Return to text.
- Szabo, B.J., Results and assessment of uranium series dating of vertebrate fossils from Quaternary alluviums in Colorado, Arct. Alp. Res. 12:95–100, 1980. Return to text.
- Bada, J.L. and Finkei, R., The upper Pleistocene peopling of the New World: evidence derived from radiocarbon, amino acid racemization and uranium series dating; in: Masters, P.M. and Flemming, N.C. (Eds.), Quaternary Coastlines and Marine Archaeology, Academic, New York/London, pp. 463–479, 1983. Return to text.
- Bada, J.L., Racemization of amino acids; in: Chemistry and Biochemistry of the Amino Acids, Barrett, G.C. (Ed.), Chapman & Hall, London, pp. 399–414, 1984. Return to text.
- Bada, J.L., Gillespie, R., Gowlett, J.A.J., and Hedges, R.E.M., Accelerator mass spectrometry–based radiocarbon ages of amino acid extracts from Californian Paleoindian skeletons, Nature 312:442–44, 1984. Return to text.
- Kriausakul, N. and Mitterer, R.M., Some factors affecting the epimerization of isoleucine in peptides and proteins; in: Hare, P.E., Hoering T.C., and King K. Jr (Eds.), Biogeochemistry of Amino Acids, Wiley, New York/Toronto, pp. 283–296, 1980. Return to text.
- Steinberg, S.M. and Bada, J.L., Peptide decomposition in the neutral pH region via the formation of diketopiperazines, J. Org. Chem. 48:2295–2298, 1983. Return to text.
- Bada, J.L. and Man, E.H., Amino acid diagenesis in Deep Sea Drilling Project cores: kinetics and mechanisms of some reactions and their applications in geochronology and in paleotemperature and heat flow determinations, Earth Sci. Rev. 16:21–55, 1980. Return to text.
- Druffel, E.R.M., Griffin, S., Witter, A., Nelson, E., Southson, J., Kashgarian, M., and Vogel, J., Gerardia: bristlecone pine of the deep sea? Geochim. Cosmochim. Acta 59:5031–5036, 1995. Return to text.
- Goodfriend, G.A., Aspartic acid racemization and amino acid composition of the organic endoskeleton of the deep-water colonial anemone Gerardia: determination of longevity from kinetic experiments, Geochim. Cosmochim. Acta 61:1931–1939, 1997. Return to text.
- Matsu’ura, S. and Ueta, N., Fraction dependent variation of aspartic acid racemization age in fossil bone, Nature 286:883–884, 1980. Return to text.
- Ohtani, S., Matsushima, Y., Ohhira, H., and Watanabe, A., Age-related changes in D-aspartic acid of rat teeth, Growth, Development and Aging 59:55–61, 1995. Return to text.
- Ohtani, S. and Yamamoto, K., Age estimation using the racemization of amino acid in human dentin, J. Forensic Sci. 36:792–800, 1991. Return to text.
- Ritz, S., Schütz, H.W., and Peper, C., Postmortem estimation of age at death based on aspartic acid racemization in dentin: its applicability for root dentin, Int. J. Legal Med. 105:289–293, 1993. Return to text.
- Gillard, R.D., Hardman, S.M., Pollard, A.M., Sutton, P.A., and Whittaker, D.K., Determinations of age at death in archaeological populations using the D/L ratio of aspartic acid in dental collagen, Archaeometry 1990:637–644, 1991. Return to text.
- Carolan, V.A., Gardner, M.L.G., Lucy, D., and Pollard, A.M., Some considerations regarding the use of amino acid racemization in human dentine as an indicator of age at death, J. Forensic Sci. 42:10–16, 1997. Return to text.
- Ritz-Timme, S. and Collins, M.J., Racemization of aspartic acid in human proteins, Ageing Research Reviews 1:43–59, 2002. Return to text.
- King, K. and Bada, J.L., Effect of in situ leaching on amino acid racemization rates in fossil bone, Nature 281:135–137, 1979. Return to text.
- Kessels, H.sJ., Dungworth, G., Necessity of reporting amino acid compositions of fossil bones where racemization analyses are used for geochronological applications: inhomogeneities of d/l amino acids in fossil bones; in: Hare, P.E., Hoering, T.C, and King, K. Jr (Eds.), Biogeochemistry of the Amino Acids, Wiley, New York/Toronto, p. 558, 1980. Return to text.
- Equation derived in Bada, J.L., The dating of fossil bones using the racemization of isoleucine, Earth Planet Sci. Lett. 15:223–231, 1972. Return to text.
- Effective temperature considers the over-proportional increase in D/L caused by higher temperature. The same D/L increase achieved via, for example, time30°C × k30°C could be attained by racemization at 40°C and 20°C but requiring durations at 40°C far shorter than at 20°C. The higher the Ea, the greater the temperature effect on k. Return to text.
- Bada, J.L., Kinetics of the nonbiological decomposition and racemization of amino acids in natural waters; in: Nonequilibrium Systems in Natural Water Chemistry, chap. 13, pp. 309–331, 1971. Return to text.
- Vardiman, L., Snelling, A.A., and Chaffin, E. (Eds.), Radioisotopes and the Age of the Earth: A young-earth creationist research initiative, Institute for Creation Research, 2000. Return to text.
- Nnaji, N.J., Ani, J.U., and Ekwonu, A.M., The solution of reversible first order reaction equation revisited, Acta Chim. Pharm. Indica 3(3):212–218, 2013. Return to text.
- Glavin, D.P. and Bada, J.L., Isolation of AAs from natural samples using sublimation, Anal. Chem. 70:3119–3122, 1998. Return to text.
- Wehmiller, J.F., Acid enantiomeric ratios in fossil Pleistocene mollusks, Quat. Res. 22:109–120, 194. Return to text.
- Bada, J.L. and Protsch, R., Racemization reaction of aspartic acid and its use in dating fossil bones, PNAS 70(5):1331–1334, 1973. Return to text.
- Gish, D., The amino acid racemization dating method, Acts and Facts, 1 May 1975. Return to text.
- Manning, J.M. and Moore, S., Determination of D- and L- amino acids by ion exchange chromatography as L–D and L–L dipeptides, J. Biological Chemistry 243:5591–5597, 1968. Return to text.
- Bada and co-authors do not mention the temperature, making it difficult to estimate how much D-Asp is being generated. The assumption seems to be that at time = 0, 7% D-Asp was present when the person died. Duane Gish states that under most circumstances AAs undergo little racemization during acid hydrolysis but that some neighbouring residues can stimulate considerable racemization.49,50 Using a cow bone to ascertain an initial D/L value adds an unnecessary source of doubt. Return to text.
- Fujii, N., Satoh, K., Harada, K., and Ishibashi, Y., Simultaneous stereo-inversion and isomerization at specific aspartic acid residues in α–α–crystallin from human lens, J. Biochem. 116:663–669, 1994. Return to text.
- Steen, A.D., Jørgensen, B.B., and Lomstein, B.A., Abiotic racemization kinetics of AAs in marine sediments, PLoS One 8(8):e71648, 2013. Return to text.
- Goodfriend, G.A. and Hare, P.E., Reply to comment by K.L.F. Brinton and J.L. Bada on “Aspartic acid racemization and protein diagenesis in corals over the last 350 years”, Geochim. Cosmochim. Acta 59:417–418, 1995. Return to text.
- Goodfriend, G.A., Brigham-Grette, J., and Miller, G.H., Enhanced age resolution of the marine quaternary record in the Arctic using aspartic acid racemization dating of bivalve shells, Quat. Res. 45:176–187, 1996. Return to text.
- Collins, M.J., Riley, M., Child, A.M., and Turner-Walker, G., A basic mathematical simulation of the chemical degradation of ancient collagen, J. Arch. Sci. 22:175–183, 1995. Return to text.
- Hensel, R., Jakob, I., Scheer, H., and Lottspeich, F., Proteins from hyperthermophilic archaea: stability towards covalent modification of the peptide chain, Biochem. Soc. Symp. 58:127–133, 1992. Return to text.
- Müller, H.T. and Heidemann, E., Untersuchung der Gesetzmässigkeiten für den Säureabbau von Hautkollagen und Identifizierung der Kollagenspaltstellen beim sauren Gelatineprozess, Das Leder 44:69–79, 1993. Return to text.


Readers’ comments
Comments are automatically closed 14 days after publication.