

Journal of Creation 33(3):77–84, December 2019
Browse our latest digital issue Subscribe
Flood impacts reinforce volcanic cooling to start the Ice Age
Some creation scientists believe that the Ice Age started several hundred years after the Flood. This would have allowed time for the complete deposition of the Cenozoic to occur after the Flood. Climate models with a warm ocean show that winters would be too warm after the Flood for the Ice Age. But computer models of snow cover, barren land, and an ash-covered surface are not sophisticated enough to model the Ice Age. Other variables could counteract the heating from the warm ocean and start the Ice Age in favourable areas immediately after the Flood. A huge amount of volcanic aerosols would help initiate the cooling. Atmospheric aerosols would be strongly reinforced by the climate effects of impacts during the Flood. The Chicxulub impact may have caused global temperatures to drop greater than 26°C for 3–15 years, with residual effects lasting up to 30 years. These powerful Flood impacts and late Flood volcanism, reinforced by copious post-Flood volcanism, also support a late Cenozoic placement of the Flood/post-Flood boundary.

There is a controversy among creation scientists as to when the post-Flood Ice Age began. Some believe it did not begin for several hundred years after the Flood because they place the Flood/post-Flood boundary at the Cretaceous/ Paleogene (K/Pg) boundary of the geological column.1-4 Other creation scientists, myself included,5-9 believe the boundary is in the late Cenozoic for numerous reasons.10
At first, it may seem that those who put the boundary in the late Cenozoic would place it at or near the Pliocene/ Pleistocene boundary, assuming the secular geological column.11 After all, it is widely believed that the Pleistocene or Quaternary represents the time of the Ice Age.12 However, many Pleistocene strata have nothing to do with the Ice Age, and the Pliocene/Pleistocene boundary cannot be considered a ‘precise’ placement for the Flood/post-Flood boundary. Rather, it can be anywhere in the late Cenozoic—the Miocene, Pliocene, or Quaternary—depending on the geographical location. In most of the regions that I have examined, the most likely placement of the Flood/post-Flood boundary is in the early Quaternary.13,14
Moreover, secular scientists sometimes change their boundary dates based on new information. For instance, the lower portion of the Pliocene Beaufort Formation on north-west Banks Island was ‘redated’ 10 million years older to the mid Miocene and given the name Ballast Brook Formation because the scientists discovered very warm climate fossils in the strata—warmer than inferred for the Pliocene.15,16 Scientists not only date rocks by fossils, but also according to the inferred Cenozoic temperature based on the fossils, like they did for the Ballast Brook Formation.
Ice Age computer model suggests Ice Age could have been delayed
A delay in the Ice Age could be deduced from a recent computer model run, using the Goddard Institute of Space Studies (GISS) climate model—first with an initial, average ocean temperature of 30°C immediately after the Flood,17,18 and second, with an average ocean temperature of 24°C.19 Dr Steven Gollmer from Cedarville University discovered that the warm oceans would prohibit the formation of ice sheets unless the high-latitude oceans cooled enough and/or the amount of aerosols (particles of around 1 μm in diameter) in the atmosphere was very high. The warm oceans would heat the lower atmosphere and, with strong evaporation, the condensation in the atmosphere would add huge amounts of latent heat. The model runs, indeed, showed that the warm ocean is a powerful source for atmospheric heat—more than I previously thought.
However, climate models are simplifications of the actual climate. Many complex processes in the atmosphere, biosphere, cryosphere, and oceans need to be modelled correctly, and the differences between the present and post-Flood climate must be accounted for. Often interactions between variables, which are sometimes non-linear, need to be accurately parameterized. Although the climate models are becoming more robust with time, they still have problems with clouds, solar and infrared radiation, ocean effects, surface albedo (especially snow), etc. Gollmer also ran his computer model out to only six model years, which probably is not enough time for the climate model to reach ‘equilibrium’. In modelling, it usually takes many years to reach equilibrium from a perturbation. Regardless, if Gollmer’s model is close to equilibrium with such warm ocean temperatures, it could probably mean that the Ice Age would be slower to develop in many areas, especially areas bathed by onshore flow of warm, moist air, heated and moistened by contact with the warm ocean. The model also shows that more precipitation likely fell over the oceans than I had estimated in the 1980s,18 but the precipitation pattern is sensitive to many other variables that need to be first modelled accurately.
For example, snow cover will reflect more sunlight back to space than most other surfaces resulting in significantly cooler temperatures (table 1), but it depends on the characteristics of the snow surface. Snow albedo is particularly difficult to model because it changes on short as well as long timescales (table 1).
Table 1. Albedos over various surfaces

Another example is the amount and type of vegetation on land. I assume that most models assume the present distribution of land vegetation at the start of the Ice Age. However, after the Flood, the land would start out barren with vegetation growing in select locations, mainly at warmer low-to-mid latitudes. The high latitudes and much of the mid latitudes, though, were likely largely barren for several years after the Flood. Barren land has a higher albedo than vegetated land by about 10 to 20% (table 1), depending upon the density of the forest and the type of soil.20
Moreover, extensive late and post-Flood volcanism would shroud large areas of the surface with light-coloured volcanic ash that has a significantly higher albedo than barren ground—near that of snow, and could last decades.23 This mechanism likely is very important for the development of the Ice Age, and photosynthesis would be little affected. Although aerosols will reflect much of the sunlight in the summer, a snow cover, barren land, and ash over some of the non-glaciated area would keep many continental areas below freezing in winter and strongly counteract summer heating. These variables may be crucial processes for modelling the Ice Age, but are difficult to model.
Volcanic eruptions cool
Gollmer’s model runs show that the amount and distribution of the volcanic aerosols is a crucial variable for cooling the land during the Ice Age. The radiational and climatic effects of aerosols depend upon many variables, such as the intensity, latitude, the amount of SO2 added to the stratosphere, and the height of injection.24 The SO2 mixes with water vapour and air in the atmosphere and becomes a sulfuric acid aerosol. Much water vapour, needed to combine with SO2, is added to the stratosphere during volcanic eruptions. It is this aerosol that produces the long-term cooling.25 These variables are difficult to model accurately.

But we do know from historical observations that large volcanic eruptions cool the climate by reflecting some of the sunlight back to space (figure 1).9,26,27 Volcanic ash usually coagulates and falls to the ground within weeks to a few months.28 Considering how fast temperatures cool at night with no solar radiation, thick volcanic ash could cause severe cooling for several weeks. However, the cooling effect of the atmospheric ash itself would be regional and short-term.
Volcanic aerosols usually fall out of the stratosphere in about 1–3 years and cool the climate in that time. For instance, the large eruption of Tambora in 1815 in Indonesia is believed by many scientists to be responsible for the ‘year without a summer’ in New England and adjacent Canada in 1816.29 And, if the aerosol is injected into the upper stratosphere by especially strong volcanoes, the cooler temperatures can last about 10 years.30
The Toba super-eruption on Sumatra occurred during the Ice Age and is believed to have produced over 50 times the stratospheric aerosols as Tambora. The temperature of the Northern Hemisphere is estimated to have cooled 3–5°C.31 Some researchers believe Toba produced even more cooling. Since the aerosol probably penetrated the upper atmosphere, the cooling would last more than the historical maximum of three years.30
However, other processes occur in super-eruptions that likely make climatic cooling estimates exaggerated and uncertain. One example is the inability of SO2 to combine with enough water vapour to form as much sulfuric acid as expected.32 Another is the coagulation of thick aerosols making them heavier and causing them to fall out of the atmosphere faster.33
Flood volcanic aerosols
The volcanic aerosols right after the Flood would be thick because of numerous Plinian eruptions that would have occurred in the Flood. The Plinian eruptions would have penetrated up through the surface and spread ash and aerosols far and wide, as reflected in the numerous ash beds in Mesozoic and Cenozoic sedimentary rocks. The numerous huge basaltic eruptions that formed large igneous provinces (LIPs)34 are considered by uniformitarian scientists to have seeded the stratosphere with a huge amount of sulfuric acid aerosols during fire fountaining during eruption.35 However, these eruptions should not produce much sulfuric acid aerosols in the Flood model with a boundary in the late Cenozoic because the LIPs erupted mostly underwater not on land as uniformitarian scientists assume.

Assuming the Cenozoic was late in the Flood (see below), numerous Plinian eruptions have been deduced. For instance, the thick, widespread Cenozoic sedimentary rocks along the northern and central High Plains of the United States represent about 60–80% volcanic ash, reworked by water.36,37 Several famous badlands have subsequently developed from erosion of the top of these sediments (figure 2). It is surmised that the volcanic eruptions occurred in southern Nevada.
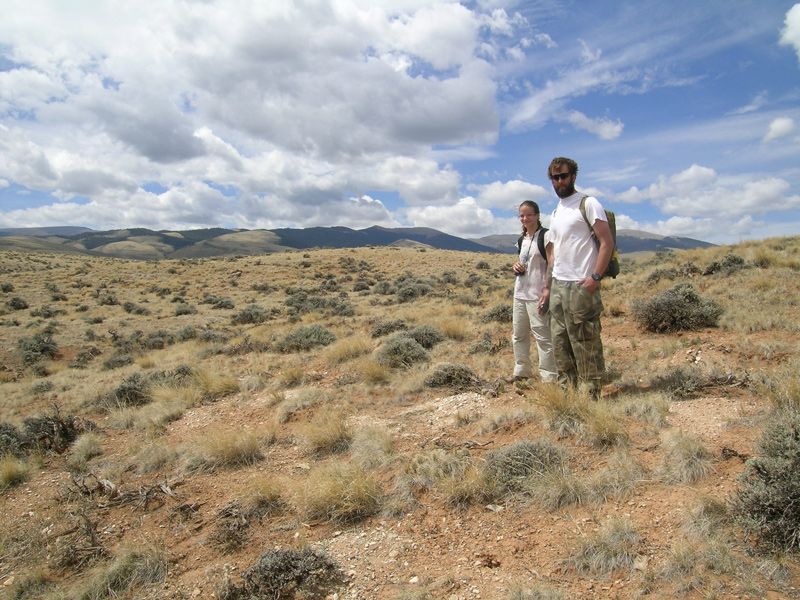
For over 30 years, I was unsure of when, in relation to the Flood, the most recent Yellowstone super-eruptions occurred, which are dated as Quaternary by secular scientists.38 Were they late Flood, post-Flood, or both? From a research project just south-east of Yellowstone Park in the upper Wind River Basin, I noticed volcanic ash from the last super-eruption within the pediment gravel (figure 3).14 Since pediments are a product of Flood runoff,39,40 the Yellowstone super-eruptions were most likely late Flood.
Such late Flood activity is also deducible from the post-Flood history of the Yellowstone area, which developed an ice cap up to 1,000 m thick.41 How could super-eruptions occur when so much ice was piling onto the Yellowstone area? If the eruptions occurred during the Ice Age, there would have been huge flooding and mass flows down the adjacent valleys, which is not observed. The Yellowstone super-eruptions have profound effects for dating sediments and sedimentary rocks in the western two-thirds of the United States, in that secular scientists use the dated ashes to correlate by tephrochronology.13
Another large Cenozoic igneous providence is an ignimbrite province that extends over a large portion of the Sierra Madre Occidental of north-west Mexico.42 Much of this mid Cenozoic ignimbrite supposedly erupted into the air. The eruptions were huge and widespread and would have seeded the stratosphere and the troposphere, with abundant SO2 causing volcanic winter after the Flood.

Great cooling inferred from the Chicxulub impact

Volcanic cooling would be reinforced by meteorite or comet impacts that would cool the climate from the debris and aerosols thrown into the atmosphere and beyond. The ‘very late Cretaceous’ Chicxulub impact on the northern coast of the Yucatán Peninsula of southern Mexico is dated at the K/Pg boundary (figure 4) and thought by many secular scientists to have killed off the dinosaurs and many other organisms. The number of Flood impacts as well as their effects are still debated among creation scientists. The Chicxulub impact may have been relatively large and resulted in a multiple-ringed crater with the outer ring about 180–200 km (113–125 mi).43,44 The impactor was estimated to be about 10 km in diameter (figure 5) and is considered the best representation of an impact crater on Earth. Dr Tim Clarey of the Institute for Creation Research is skeptical of the claimed large size of the Chicxulub impact because it lacks some major impact diagnostic signatures, such as it is missing an iridium anomaly and had a low amount of melted rocks and broken up rock.45 However, it still had a fairly circular gravity anomaly with a claimed peak ring and a possible annular low, up to several hundred metres of suevite,46 shocked quartz, coesite,47 a little pseudotachylyte,48 a small amount of melt, and a few shattercones (figure 6).49,50 There was 130 m of suevite encountered in a new drill hole into the claimed peak ring structure.51 Clarey makes a case that most of these diagnostic features can be formed by other mechanisms. However, when all together in one place, I believe that it was a true Flood impact.
However, neither the Chicxulub crater nor the approximately 200 other secular recognized craters on Earth are ideal examples because Flood processes would likely have modified them. Two other large impacts, the Precambrian Sudbury and Vredefort impacts, have been greatly modified by tectonics and erosion.51 Impact craters would be subject to subsequent faulting, isostatic rebound or subsidence, erosion, and sedimentation. Because of the Flood, no earlier impact will be pristine, and the evidence for most of them would be destroyed or mostly destroyed. I believe there were many more than 200 impacts during the Flood, possibly in the thousands, but not the number that Spencer and I had earlier calculated using the Moon as an analogue.52,53
Recent research on the Chicxulub impact has shown that it likely ejected more aerosols into the stratosphere, resulting in greater global cooling, than previously thought.54 A large impact will blast particles up into the stratosphere, which can cause global cooling. However, the amount of cooling will depend upon several variables, such as the target rock and how much SO2 and CO2 enters the stratosphere. Mid- and high-latitude eruptions and impacts would tend to spread the aerosols mainly within that hemisphere, while large tropical eruptions and impacts will eventually spread their aerosols over the whole globe in a matter of a few months. The added CO2 will cause warmer temperatures. But this occurs mainly after most of the sulfuric acid falls out of the atmosphere, and it depends on the carbon dioxide sensitivity with temperature, or in other words the temperature change caused by a certain increase or decrease in CO2.
Researchers did not know how much SO2 would enter the atmosphere from the Chicxulub impact, since the target rocks had both carbonates and ‘evaporites’, some of which are sulfur-rich anhydrite (CaSO4). But with more drilling offshore of the Yucatán Peninsula, it was discovered that the Chicxulub impact may have disintegrated more evaporites than expected, causing more SO2 to enter the stratosphere.54 It also may have added less CO2 than previously thought. The global temperature drop is thus now believed to have been greater than the older estimate of a 26°C drop for 3–15 years with residual effects to 30 years.55 Although this was a Flood impact, the cooling would extend well after the Flood. This effect is potentially much greater than those from large volcanic eruptions like Tambora and even Toba. Much more dramatic cooling results because impact aerosols reach up into the mid and upper stratosphere, while volcanic aerosols usually reach only the lower stratosphere.56 The climate effect depends upon the stratospheric residence time of the aerosols. Such intense volcanic and impact cooling right after the Flood may inhibit photosynthesis in many areas.
Therefore, after the Flood a huge amount of volcanic and impact aerosols would be in the stratosphere causing a cool climate over the continents. This justifies the use of the high aerosol content in Gollmer’s model runs. This huge amount of aerosols, plus the high albedo of much of the mid- and high-latitude continental surfaces, would likely be enough to trigger the Ice Age in favourable areas.
The Ice Age starts slowly in favourable areas


The combination of ‘volcanic winter’ and ‘impact winter’ likely resulted in substantial global cooling on the continents for a few decades immediately after the Flood. The oceans would be little affected because of the high heat capacity of water. The Ice Age then would have progressed from the favourable areas after a few decades to reach a maximum with copious post-Flood volcanism, a little cooler mid- and high-latitude sea surface temperatures, and established areas of snow cover resulting in a high albedo.
Because of the modifying effects of the warm ocean, the Ice Age would develop in favourable areas first. There would not be a delay of a few hundred years, except in areas especially influenced by onshore flow of warm, moist air. One favourable area would be in high- and mid-latitude continental areas far from the onshore flow. Central Canada would be most favourable (figure 7). Eastern Canada and north-east Europe would not be far behind (figure 8). High mountains at high latitudes would also be favoured for the rapid development of ice caps, since the temperature would cool with altitude.
Climate would still not be warm even if the Ice Age were delayed
With volcanic and impact winter occurring on land, and regardless of the temperature effect of the warm ocean as modelled by Gollmer, the high latitudes and mid-continental areas at mid latitudes would not have subtropical-to-tropical temperatures, as demanded by Cenozoic fossils.9 So, I conclude that most of the Cenozoic is most likely not post-Flood, just on the above two criteria. And it fits with my earlier conclusions based on 30 other criteria that I have developed.57

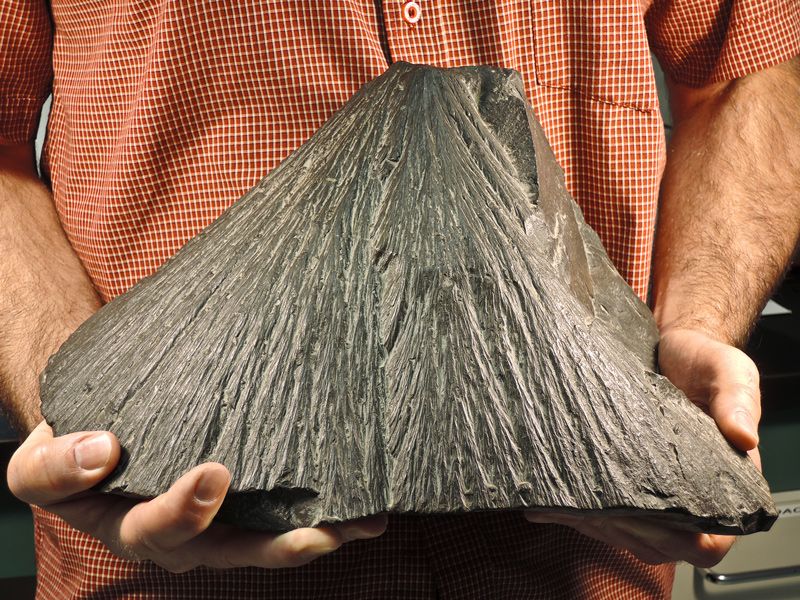
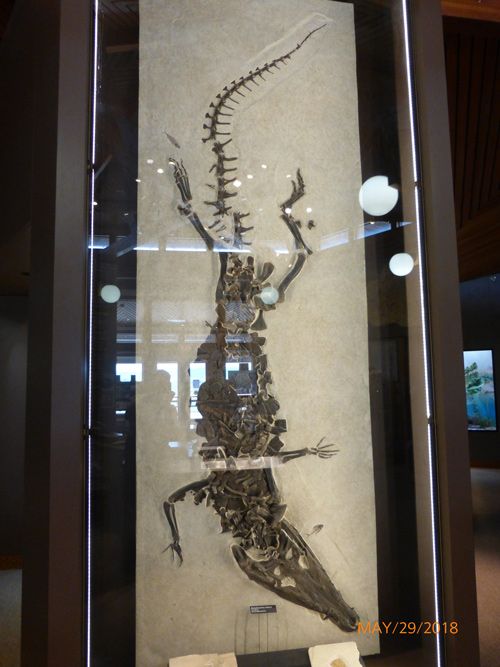
For instance, mild climate plant fossils and pollen are found from sedimentary rocks in central Siberia.58,59 In lower Cenozoic strata in southern England, palms and mangroves are among the tropical fossils found.60 Palms and swamp cypress are found in sedimentary rocks on the island of Spitsbergen in the Svalbard archipelago, north of Norway at about 80°N.61 Petrified palm fruits have been discovered in north-western Greenland.62 Tropical and subtropical plant and animal fossils, such as palms (figure 9) and crocodiles (figure 10), are found in the Eocene Green River Formation (GRF) in the central Rocky Mountains.63 The GRF is far from the ocean and straddles the continental divide near 2,400 m altitude in south-west Wyoming. It contains early Cenozoic crocodiles, large tortoises that cannot hibernate, tree ferns, and palm fossils. These warm climate fossils are found not only in Wyoming, but are also found farther north in Montana.64,65,66 Palms, swamp cypress, mangroves, climbing vines, and other plants that would be found today in a warm, if not tropical, climate are abundant in the Cenozoic of Alaska.67 All these fossils are greatly out of place for the climate and conditions there now, and even in the climate that prevailed in the centuries immediately after the Flood.
Conclusions
A previous climate model run with a warm ocean shows that the continents may be too warm for ice sheets to start growing right after the Flood, even with significant volcanic loading of the stratosphere. This would suggest that the Ice Age was delayed, possibly supporting the views of those who advocate that the Cenozoic was warm and post-Flood. However, climate models are simplifications of nature and do not parameterize many atmospheric processes well. This paper has identified several likely processes that would be a positive reinforcement for the early development of the Ice Age in some areas: (1) an accurate snow aging effect; (2) the higher albedo of barren land; and (3) the higher albedo of land covered with volcanic ash.
Large, andesitic volcanic eruptions are known to cool the earth. Volcanism and extraterrestrial impacts together would have likely been immense during the late Flood, and stratospheric aerosols would kick-start the development of ice sheets. Just the late Flood Chicxulub impact, itself, could have cooled the global climate by over 26°C for three to 15 years with residual effects to 30 years. This would start the Ice Age right after the Flood in selected locations. Regardless of the effects of the warm ocean, one thing is for sure for the scenario that the Cenozoic is post-Flood: the early post-Flood climate would have been too cold to account for the consequent Cenozoic ‘history’.
Acknowledgments
I thank Drs Steve Gollmer and Larry Vardiman for reviewing and commenting on an earlier draft of the manuscript.
References and notes
- Whitmore, J.H. and Garner, P., Using suites of criteria to recognize pre-Flood, Flood, and post-Flood strata in the rock record with application to Wyoming (USA); in: Snelling, A.A. (Ed.), Proceedings of the Seventh International Conference on Creationism, Creation Science Fellowship, Pittsburgh, PA, pp. 425–448, 2008. Return to text.
- Whitmore, J.H. and Wise, K.P., Rapid and early post-Flood mammalian diversification evidences in the Green River Formation; in: Snelling, A.A. (Ed.), Proceedings of the Seventh International Conference on Creationism, Creation Science Fellowship, Pittsburgh, PA, pp. 449–457, 2008. Return to text.
- Whitmore, J., The potential for and implications of widespread post-Flood erosion and mass wasting processes; in: Horstemeyer, M. (Ed.), Proceedings of the Seventh International Conference on Creationism, Creation Science Fellowship, Pittsburgh, PA, 2013. Return to text.
- Snelling, A.A., Locating the Flood/post-Flood boundary using the relative dating of the weathering of ore deposits; in: Whitmore, J.H. (Ed.), Proceedings of the Eight International conference on Creationism, Creation Science Fellowship, Pittsburgh, PA, pp. 553–566, 2018. Return to text.
- Oard, M.J., Flood processes into the late Cenozoic—sedimentary rock evidence, J. Creation 30(2):67–75, 2016. Return to text.
- Oard, M.J., Flood processes into the late Cenozoic: part 3—organic evidence, J. Creation 31(1):51–57, 2017. Return to text.
- Oard, M.J., Flood processes into the late Cenozoic: part 4—tectonic evidence, J. Creation 31(1):58–65, 2017. Return to text.
- Oard, M.J., Flood processes into the late Cenozoic: part 5—geomorphological evidence, J. Creation 32(2):70–78, 2018. Return to text.
- Oard, M.J., Flood processes into the late Cenozoic: part 6—climatic and other evidence, J. Creation 33(1):63–70, 2019. Return to text.
- Clarey, T.L., Local catastrophes or receding Floodwater? Global geologic data that refute a K-Pg (K-T) Flood/post-Flood boundary, CRSQ 54(2):100–120, 2017. Return to text.
- Ross, M.R., Evaluating potential post-Flood boundaries with biostratigraphy—the Pliocene/Pleistocene boundary, J. Creation 26(2):82–87, 2012. Return to text.
- Pillans, B. and Gibbard, P., The Quaternary Period; in: Gradstein, F.M., Ogg, J.G., Schmitz, M., and Ogg, G., The Geological Timescale 2012, vol. 2, Elsevier, New York, pp. 979–1010, 2012. Return to text.
- Oard, M.J., Relating the Lava Creek ash to the post-Flood boundary, J. Creation 28(1):104–113, 2014; creation.com/lava-creek-ash. Return to text.
- Oard, M.J., Were the Wind River terraces caused by multiple glaciations? CRSQ 50(3):154–171, 2014. Return to text.
- Fyles, J.G., Matthews, Jr., J.V., Barendregt, R., Baker, J., Irving, E., and Jetté, H., Ballast Brook and Beaufort Formations (late Tertiary) on northern Banks Island, Arctic Canada, Quaternary International 22/23:141–171, 1994. Return to text.
- Williams, C.J., Mendell, E.K., Murphy, J., Court, W.M., Johnson, A.H., and Richter, S.L., Paleoenvironmental reconstruction of a Middle Miocene forest from the western Canadian Arctic, Palaeogeography, Palaeoclimatology, Palaeoecology 261:160–176, 2008. Return to text.
- Gollmer, S.M., Initial conditions for a post-Flood Ice Age; in: Horstemeyer, M. (Ed.), Proceedings of the Seventh International Conference on Creationism, Creation Science Fellowship, Pittsburgh, PA, 2013. Return to text.
- Oard, M.J., An Ice Age Caused by the Genesis Flood, Institute for Creation Research, Dallas, TX, 1990. Return to text.
- Gollmer, S.M., Effects of aerosol distribution on precipitation patterns needed for a rapid ice age; in: Whitmore, J.H. (Ed.), Proceedings of the Eight International conference on Creationism, Creation Science Fellowship, Pittsburgh, PA, pp. 695–706, 2018. Return to text.
- Peixoto, J.P. and Oort, A.H., Physics of Climate, American Institute for Physics, New York, p. 104, 1992. Return to text.
- Byers, H.R., General Meteorology, 3rd edn, McGraw-Hill, New York, 1959. Return to text.
- Cuffey, K.M. and Patterson, W.S.B., The Physics of Glaciers, 4th edn, Elsevier, New York, p. 146, 2010. Return to text.
- Jones, M.T., Sparks, R.S.J., and Valdes, P.J., The climatic impact of supervolcanic ash blankets, Climate Dynamics 29:553–564, 2007. Return to text.
- Vidal, C.M., Métrich, N., Komorowski, J.C., Pratoma, I., Michel, A., Kartadinata, N., Robert, V., and Lavigne, F., the 1257 Samalas eruption (Lombok, Indonesia): the single greatest stratospheric gas release of the Common Era, Scientific Reports 6(34868):1–13, 2016. Return to text.
- Devine, J.D., Sigurdsson, H., and Davis, A.N., Estimates of sulfur and chlorine yield to the atmosphere from volcanic eruptions and potential climatic effects, J. Geophysical Research 89(B7):6309–6325, 1984. Return to text.
- Oard, ref. 18, pp. 33–38, 67–70. Return to text.
- Oard, M.J., Frozen in Time: Woolly Mammoths, the Ice Age, and the Biblical Key to Their Secrets, Master Books, Green Forest, AR, pp. 71–74, 2004. Return to text.
- Toon, O.B., Pollack, J.P., Ackerman, T.P., Turco, R.P., McKay, C.P., and Liu, M.S., Evolution of an impact-generated dust cloud and its effects on the atmosphere; in: Silber, L.T. and Schultz, P.H. (Eds.), Geological Implications of Impacts of Large Asteroids and Comets on the Earth, GSA Special Paper 190, Geological Society of America, Boulder, CO, pp. 187–200, 1982. Return to text.
- Hughes, P., The year without a summer, Weatherwise 32:108–111, 1979. Return to text.
- Robock, A., Ammann, C.M., Oman, L., Shindell, D., Levis, S., Stenchikov, G., Did the Toba volcanic eruption of ~74 ka B.P. produce widespread glaciation? J. Geophysical Research 114(D10107):1–9, 2009. Return to text.
- Rampino, M.R. and Self, S., Climate-volcanism feedback and the Toba eruption of ~74,000 years ago, Quaternary Research 40:269–280, 1993. Return to text.
- Timmreck, C., Graf, H.-F., Zanchettin, D., Hagemann, S., Kleinen, T., and Krüger, K., Climate response to the Toba super-eruption: regional changes, Quaternary International 258:30–44, 2012. Return to text.
- Timmreck, C., Graf, H.-F., Lorenz, S.J., Niemeier, U., Zanchettin, D., Matei, D., Jungclaus, J.H., and Crowley, T.J., Aerosol size confines climate response to volcanic super-eruptions, Geophysical Research Letters 37(L24705):1–5, 2010. Return to text.
- Mahoney, J.J. and Coffin, M.F. (Eds.), Large Igneous Provinces: Continental, Oceanic, and Planetary Flood Volcanism, Geophysical Monograph 100, American Geophysical Union, Washington, D.C., 1997. Return to text.
- Thordarson, T. and Self, S., Atmospheric and environmental effects of the 1783–1784 Lake eruption: a review and reassessment, J. Geophysical Research 108(D1):1–29, 2003. Return to text.
- Benton, R.C., Terry Jr., D.O., Evanoff, E., and McDonald, H.G., The White River Badlands: Geology and Paleontology, Indiana University Press, Indianapolis, IN, 2015. Return to text.
- Klevberg, P., personal communication. Return to text.
- Secular scientists at first believed in one super-eruption of Yellowstone but because of fission track dating in ash from the Midwest of the United States, they now claim there were three super-eruptions. Return to text.
- Oard, M.J., Pediments formed by the Flood: evidence for the Flood/post-Flood boundary in the late Cenozoic, J. Creation 18(2):15–27, 2004. Return to text.
- Oard, M.J., Reply on Pediments from John Whitmore, J. Creation 18(3):94, 2004. Return to text.
- Licciardi, J.M. and Pierce, K.L., History and dynamics of the Greater Yellowstone Glacial System during the last two glaciations, Quaternary Science Reviews 200:1–33, 2018. Return to text.
- Bryan, S.E. and Ferrari, L., Large igneous provinces and silicic large igneous provinces: progress in our understanding over the last 25 years, GSA Bulletin 125(7/8):1053–1078, 2013. Return to text.
- Gulick, S.P.S., Barton, P.J., Christeson, G.L., Morgan, J.V., McDonald, M., Mendoza-Cervantes, K., Pearson, Z.F., Surendra, A., Urrutia-Fucugauchi, J., Vermeesch, P.M., and Warner, M.R., Importance of pre-impact crustal structure for the asymmetry of the Chicxulub impact crater, Nature Geoscience 1:131–135, 2008. Return to text.
- Gulick, S.P.S., Christeson, G.L., Barton, P.J., Grieve, R.A.F., Morgan, J.V., and Urrutia-Facugauchi, J., Geophysical characterization of the Chicxulub impact crater, Reviews of Geophysics 51:31–52, 2013. Return to text.
- Clarey, T.L., Do the data support a large meteorite impact at Chicxulub? ARJ 10:71–88, 2017. Return to text.
- Suevite is a broken-up rock deposit that contains deformed melt rock clasts and glass. Return to text.
- Coesite is a high-pressure form of quartz. Return to text.
- Pseudotachylyte is a special type of broken-up rock that contains some frictional melt and is caused by catastrophic faulting. Return to text.
- Shattercones are cone-shaped striated rocks associated with meteorite impacts, but the exact formation mechanism is unknown. Return to text.
- Christeson, G.L. et al., Extraordinary rocks from the peak ring of the Chicxulub impact crater: P-wave velocity, density, and porosity measurements from IODP/ ICDP Expedition 364, Earth and Planetary Science Letters 495:1–11, 2018. Return to text.
- Kring, D.A., Claeys, P., Gulick, S.P.S., Morgan, J.V., Collins, G.S., and IODP-ICDP Expedition 364 Science Party, Chicxulub and the exploration of large peak-ring impact craters through scientific drilling, GSA Today 27(10):4–8, 2017 | doi: 10.1130/GSATG352A. Return to text.
- Oard, M. J., How many impact craters should there be on the earth? J. Creation 23(3):61–69, 2009. Return to text.
- Spencer, W., Impacts and Noah’s Flood—how many and other issues, J. Creation 27(1):85–89, 2013. Return to text.
- Artemieva, N., Morgan, J., and Expedition 364 Scientific Party, Quantifying the release of climate-active gases by large meteorite impacts with a case study of Chicxulub, Geophysical Research Letters 44:10180–10188, 2017. Return to text.
- Brugger, J., Feulner, G., and Petri, S., Baby, its cold outside: climate model simulations of the effects of the asteroid impact at the end of the Cretaceous, Geophysical Research Letters 44:419–427, 2017. Return to text.
- Robock, A., Oman, L., and Stenchikov, G.L., Nuclear winter revisited with a modern climate model and current nuclear arsenals: still catastrophic consequences, J. Geophysical Research 112(D13107):1–14, 2007. Return to text.
- Oard, M.J., 2014. The Flood/Post-Flood Boundary is in the late Cenozoic with Little Post-Flood Catastrophism, michael.oards.net/PostFloodBoundary.htm. Return to text.
- Spicer, R.A., Ahlberg, A., Herman, A.B., Hofmann, C.-C., Raikevich, M., Valdes P.J., and Markwick, P.J., The Late Cretaceous continental interior of Siberia: a challenge for climate models, Earth and Planetary Science Letters 267:228–235, 2008. Return to text.
- Oard, M.J., Climate models fail to produce warm climates of the past, J. Creation 23(2):11–13, 2009; creation.com/climate-models-fail. Return to text.
- Collinson, M.E. and Hooker, J.J., Vegetational and mammalian faunal changes in the early Tertiary of southern England; in: Friis, E.M., Chaloner, W.G., and Crane P.R. (Eds.), The Origins of Angiosperms and Their Biological Consequences, Cambridge University Press, Cambridge, UK, pp. 259–303, 1987. Return to text.
- Schweitzer, H.-J., Environment and climate in the early Tertiary of Spitsbergen, Palaeogeography, Palaeoclimatology, Palaeoecology 30:297–311, 1980. Return to text.
- Koch, B.E., Fossil Plants from the Lower Paleocene of the Agatdalen (Angmârtussut) area, central Nûgssuaq Peninsula, northwest Greenland, Meddelelser Om Grønland 172(5):1–120, 1963. Return to text.
- Grande, L., Paleontology of the Green River Formation with a Review of the Fish Fauna, The Geological Survey of Wyoming Bulletin 63, Laramie, WY, 1984. Return to text.
- Brattstrom, B.H., Some new fossil tortoises from western North America with remarks on the zoogeography and paleoecology of tortoises, J. Paleontology 35:543–560, 1961. Return to text.
- Wing, S.L. and Greenwood, D.R., Fossils and fossil climate: the case for equable continental interiors in the Eocene, Philosophical Transactions of the Royal Society of London B 341:243–252, 1993. Return to text.
- Kerr, R.A., Fossils tell of mild winters in an ancient hothouse, Science 261:682, 1993. Return to text.
- Wolfe, J.A., Paleogene floras from the Gulf of Alaska region, U.S. Geological Survey Professional Paper 997, U.S. Government Printing Office, Washington D.C., 1977. Return to text.


Readers’ comments
Comments are automatically closed 14 days after publication.