

Journal of Creation 34(3):53–63, December 2020
Browse our latest digital issue Subscribe
Hierarchical clustering in dinosaur baraminology studies
Is Archaeopteryx a part of the same baramin as land-based dinosaurs?
A recent baraminology study places the bird species Archaeopteryx lithographica together with the terrestrial dromaeosaurid theropod Velociraptor mongoliensis. This despite the two species being created on Day 5 and Day 6 of Creation Week, respectively. This data set was entropy-filtered and re-analyzed, yet the same error persisted. To correct this, the distance matrix from the BDIST results of the filtered data sets were transformed into a proximity matrix and hierarchical clustering was applied to it. This way A. lithographica clustered away from theropod dinosaurs such as V. mongoliensis, together with other bird species such as Anchiornis huxleyi to form a bird cluster. Using two separate data sets, one or two tyrannosaurid clusters were predicted. One more theropod cluster, as well as a dromaeosaurid, troodontid, and oviraptor cluster, was predicted as well as the family Ornithomimidae. These clusters can be viewed as putative baramins.

Genesis describes flying creatures (עוֹף, or “oph” in Hebrew), such as bats and birds, separately from terrestrial animals, such as most reptiles created on Day 5 and Day 6 of Creation Week, respectively. Reptiles are defined as mainly terrestrial animals that lack feathers and hair, and also have scaly skin and lay soft-shelled eggs. Since God created these two distinctly demarcated animal groups on separate days, they necessarily must belong to separate baramins, because they are the results of separate creative acts of God. Pterosaurs are flying reptiles, so they would have been created on Day 5 of Creation Week, together with birds and bats. Conversely, several bird species do not fly, such as rails and ostriches. These birds may either have been created to be incapable of flight, or, more likely, lost flight capability altogether.
A relatively recent baraminology paper by McLain et al. using the BDIST algorithm incorrectly lumped the bird species Archaeopteryx lithographica into the same cluster with terrestrial animals, such as dinosaurs, for example Velociraptor mongoliensis.1 Archaeopteryx has the anatomy of a flying bird, thus it was created on Day 5. Therefore, it cannot be classified as a terrestrial dinosaur.
It is highly unlikely that V. mongoliensis also would have had feathers, even though some scientists point to bony knobs on its ulna as quill knobs.2 An alternative and defensible position suggests that these tiny structures on Velociraptor are unlikely to be quill knobs, but rather are attachment sites for anchoring tendons or connective tissue. They are more shallow, more irregularly spaced, smaller in proportion to body size, and positioned elsewhere on the ulna than living bird quill knobs. Figure 1A, in Turner reference 2, compares the ulnae of Velociraptor and turkey vulture (part C of the figure) Quill knobs are not necessarily indicative of feathers—they are possible indicators of a particular type of flight. Only certain flying birds that experience high stress while flying require quill knobs. For example, the albatross lacks them due to its gliding style of flight.
Pennaceous feathers have never been found buried together with V. mongoliensis or Dakotaraptor, meaning that it is unlikely that they would have had quill knobs on the bones of their forearms.3 Some non-avian vertebrates also have knobs which serve as attachment points for structural elements such as fascia. Quill knobs appear in certain birds which undergo high-stress flying. The quill knobs of Dakotaraptor are ovoid and irregularly shaped, and are also unevenly spaced.4 The quill knobs of Dineobellator are also broad, rounded, and irregularly spaced, as opposed to the quill knobs of Cathartes (turkey vulture), seen in part C of figure 1 of Jasinski, 2020.5
What many scientists believe is evidence for protofeathers in dinosaurs falls short under scrutiny. After more careful examination, filamentous structures in the skin of Sinosauropteryx proved to be parts of a unified structural element—possibly a crest which runs from the neck down to the tail.3 Even a ceratopsian dinosaur, Psittacosaurus, and the heterodontosaurid Tianyulong had such filamentous elements, even though these species are ornithischians, which are not in the alleged lineage of dinosaurs evolving into birds.6 Such collagen fibres, called pycnofibres, are also present on the membrane-like wing structures of several pterosaurs, such as Jeholopterus and Nemicolopterus. However, such structures would cause drag during flight for these creatures, and accelerate heat dissipation when wet due to rain. In comparison, bats also have membranous, hairless wings and need to expend more energy heating themselves in the rain.6
The discovery that seemingly identical structures have also been found in pterosaurs has caused some to assume that pterosaurs were also covered in a dense feathery covering, but this does not explain why they are also found in marine creatures. These pterosaur ‘pycnofibres’ are very likely just collagen and keratin structures in their partially degraded state. Pycnofibres are indistinguishable from what some identified as protofeathers in dinosaurs. Conversely, if these pterosaurs were not feathered, neither were dinosaurs.7
One of the problems with feathered dinosaur claims is that partially decayed skin collagen is often mistaken for downy feathers. Lingham- Soliar’s two-volume work, The Vertebrate Integument, is widely regarded as the most detailed work on the taphonomy of integumentary structures. He demonstrates that similar fuzzy structures have been found on decaying sharks and dolphins and even fossilized marine reptiles and flying reptiles. “All reported cases of protofeathers in dinosaurs, marine reptiles, and flying reptiles alike, show a striking similarity to the structure and levels of organization of dermal collagen. The proposal that these fibres are protofeathers is dismissed.” Thus, while creationists may hypothesize that Velociraptor had volant ancestors, and thus created on Day 5, this has to be much better established.
Overview of the BDIST method and hierarchical clustering
The BDIST method is a morphology-based baraminology algorithm, which quantitively compares the similarities and differences between the traits of a set of input species.8 The algorithm calculates the baraminic distance between any two species in the following way: dij=mij/nij, where ni,j is the number of comparable characteristics between species i and j, mi,j is the number of mismatching characteristics, and di,j is the distance between the two species.
As a hypothetical example, if we compare 100 characteristics for a horse and a zebra, two animals from the same baramin, we’ll find that they differ in only five characteristics, thus dhorse,zebra = 5/100 = 0.05. If we compare a horse with a lion, we’d find bigger differences, let’s say 40. Thus the distance dhorse,lion = 40/100 = 0.4. These distance values are then put into a matrix, which can then be analyzed by clustering algorithms, such as the k-means algorithm, which belongs to the family of hierarchical clustering algorithms.9
Hierarchical clustering involves partitioning a set of N entities, such as species, into K partitions (clusters), where 1 ≤ K ≤ N. Hierarchical clustering methods fall into one of two main categories: bottom-up (or agglomerative) or topdown methods. The result of bottom-up algorithms is a nested hierarchy of clustered entities. Top-down approaches involve optimally splitting all the entities into K clusters.
Each hierarchical clustering method uses a dissimilarity and a linkage function to cluster the data. Dissimilarity functions are used to calculate the distance between the entities. These functions include squared Euclidean distance, Manhattan distance, or 1 – │PCC│, where PCC stands for the Pearson Correlation Coefficient. In this way, the distance measurement (or a derivation thereof) used by the BDIST algorithm can be used in further analyses using a hierarchical clustering algorithm. The linkage function dictates how pairwise entities (species, clusters or both) are connected to one another to form clusters.10 Linkage functions include Ward’s algorithm, single, complete, and average linkage.
The relationships and distances between entities can be depicted on a dendrogram. The number of clusters can be determined by cutting branches at a certain height in the dendrogram. In baraminology, these clusters ideally correspond to the created kinds. Other algorithms, such as k-Means or PAM (Partition Around Medoids) clustering, can be used to cluster species hierarchically. The k-Means algorithm is a vector quantization method that is frequently used for cluster analysis by grouping objects since it quickly finds the centres of the clusters. The algorithm prefers groups with low variance and similar size. The PAM algorithm discovers objects called medoids, that are centrally located in clusters. The algorithm tries to minimize the distance between the objects and their closest medoid.
Previous studies and goal
Another baraminology methodology paper, which applied data filtering based on entropy measurement, attempted to correct this over-clustering tendency in some of the data used by McLain et al.11 It helped resolve baramins into more anatomically sensible (less inclusive) groupings, but it did not separate A. lithographica from terrestrial dinosaurs in two data sets from Lee et al.29, Brusatte et al.12, van der Reest et al.13, and Lamanna et al.14
Over-clustering and misclustering may result from two different causes. The first cause may be due to the use of pre-filtered data sets obtained from evolutionary studies. When creating data sets, individual characters may be chosen, and values may be assigned to them based on one’s presuppositions. Evolutionary data sets might emphasize certain traits which support one or another evolutionary trajectory. For example, bird feathers may be conflated with dinosaur dermal collagen.15 Therefore, if biased data goes in, we get biased results from the algorithm, regardless how well it was programmed.
It is extremely difficult—even impossible—to solve this problem, because it would involve manually evaluating and filtering possibly several hundred characters over dozens of species. However, the data set may be improved using an entropy-filtering algorithm. In addition, we can try to alleviate this problem by using a different clustering algorithm than the one used by BDIST.
The goal of this study is to apply another clustering algorithm in an attempt to get more accurate results from analyzing the filtered data sets of the previous baraminology study. The algorithm is outlined in the Materials and Methods section, followed by the results.
Materials and Methods
Data
Distance matrixes were built following the methods of Brusatte, van der Reest and Lamanna studies12-14 and the results of this study are available on github (github.com/csmatyi/EntropyFilter2). The Livezey and Zusi data set is available at morphobank.org/index.php/Projects/DownloadProjectPage/project_id/510. It was downloaded and recoded from letter characters to numerals (i.e. a=1, b=2, etc.) for use in the BDIST algorithm.
All supplementary data files are available online at github.com/csmatyi/dino_reanalysis. The Cytoscape file for creating figure 5 (dino_baramins.cys) is also available at this web address.
Methods
The proximity matrix was derived using the following simple equation:
pi,j=1– di,j
where di,j stands for the baraminic distance between two species i and j as calculated by the BDIST algorithm, and where pi,j is the corresponding proximity value for the same two species. This transformed matrix was visualized as a heatmap with the ‘heatmap’ command in R, using the ‘average’ clustering method. The ‘cutree’ command was used to determine clusters for the data sets based on the estimated number of clusters.
A Hopkins clustering measurement value above 0.5 corresponds to a data set which is acceptable for cluster analysis. A value above 0.75 denotes a good quality data set for such analysis. 16 Version 3.6.0. of R was used.17 Cytoscape 3.7.2. was used to generate figure 6.
The BDIST algorithm was used for analysis of the Livezey and Zusi data set, available at coresci.org/bdist. html.18,19 A relevance cut-off of 0.95 was used in the analysis. The EntropyFilter.R R script was used, and is available at github.com/csmatyi/EntropyFilter2.
Results
Analysis of the Livezey and Zusi bird data set
To ensure accurate results with the data we are analyzing, we decided to run the algorithm on a data set, which can serve as a sort of gold standard. This data set contains morphological measurements of birds whose baraminic status is well known. Birds have been studied extensively in baraminology studies, and baraminologists can say with a high level of confidence which baramin(s) these birds belong to, for example that of Galliformes, or the ‘landfowl’ kind.20 The validity of this kind has been supported by biblical evidence, hybridization data, and ortholog protein content.21

A morphological data set containing data for 2,954 characters for a wide variety of 188 bird species assembled by Livezey and Zusi22 was analyzed. The BDIST software was used to analyze this data set using a relevance cut-off value of 0.95. The result can be seen in supplementary figure 1. The algorithm separated Aves from Reptilia+Archaeopteryx. The stress graph (supplementary figure 2) also shows minimal stress at only two dimensions. This result does an excellent job at illustrating the need to improve the BDIST algorithm with a better clustering method.
Thus, the data set was entropy filtered, using the Entropy Filter R script, described in the Materials and Methods section. A maximum ratio of undetermined values was set to 25% for both rows and columns. The minimum entropy value was set to 0.25. During this process, the percent of undetermined values dropped from 22.1% to 1.6%. The mean character entropy rose from 0.32 to 0.57. Of the 188 initial species, 147 (78%) remained, with 1,136 of the 2,954 characters (38.4%) also remaining, corresponding to a 3.3- fold data reduction. The filtered data set was then inputted into the BDIST algorithm. The results can be seen in supplementary figure 3: entropy filtering resulted in two larger and three smaller clusters. However, as can be seen in the stress graph in supplementary figure 4, there is minimal stress at 49 dimensions. Clearly, the clustering method must be improved.

Therefore, the distance matrix resulting from the BDIST analysis on the filtered data set was transformed into a proximity matrix according to the procedure outlined in Materials and Methods. Hierarchical clustering was applied to this matrix, which can be seen in the baraminic heatmap in figure 1.
In total, 70 putative clusters were discovered, among them many small groups, as can be seen in the baraminic heatmap. The species and cluster number for the 147 species can be found in supplementary file 1 online, seen in table 1. Overall, 16 statistically significant putative clusters were discovered using hierarchical clustering. These clusters correspond to several orders, superfamilies or families of birds. For example, the superfamily Galliformes was found in the analysis of the proximity data set.21 Several groups within the Caprimulgiformes apobaramin also emerged. These include the families Caprimulgus+Nyctibius+Podargus. The genus Steatornis and Aegotheles formed their own cluster. In contrast with previous baraminology studies, Podargus didn’t belong to the same cluster as Steatornis.23 This may be due to the fact that a large number of species were taken from a large number of groups in this study.
Table 1. List of putative clustering, which is the result of hierarchical clustering of the proximity matrix, derived from the entropy-filtered data set of Livezey and Zusi

The Brusatte data set
To assess the cluster tendency of our data sets, the Hopkins clustering statistic was used. For the proximity data set of the Brusatte results we calculated a value of 0.871. This means that this data set can very well be used for cluster analysis. In the following, we will refer to groups of species found by our algorithm as clusters. Hypothetically, these clusters should correspond to baramins, but can only be labelled as such tentatively, until supported by further evidence.
Following this method, seven clusters were found. The proximity matrix is displayed in figure 2. Here we can see four larger clusters, and three singleton species, Archaeopteryx lithographica, Citipati osmolskae, and Shuvuuia deserti. Whereas in the previous analysis these three species were lumped together with the dromaeosaurids, they now stand separately.
Next, we compared how this clustering relates to the old analyses (table 2). As we can see, 14 of the 19 species (73.7%) were assigned to the same group. In table 3 the four largest clusters are listed with at least three members. These are tyrannosaurids 1 and 2, dromaeosaurids, and the family Ornithomimidae. The four largest clusters (ones with more than two members) have statistically significant p-values. The proximity matrix and the clusters and stats are available online in supplementary file 2.
Table 2. Difference in clustering using the BDIST method and hierarchical clustering for the entropy-filtered Brusatte data set

Table 3. Statistics for the hierarchical clustering for the entropy-filtered Brusatte data set

The van der Reest data set
Next, we wanted to see how well we could reclassify species from the van der Reest data set. The Hopkins clustering statistic for the proximity matrix used for this data set was 0.746, which is fair quality for clustering, but somewhat worse than the Brusatte data set. Using hierarchical clustering revealed 10 clusters, which are presented as a proximity matrix (heatmap in figure 3). In the heatmap we can see four larger groups—species belonging to clusters 1, 3, 5, and 7 listed in supplementary data file 2. These four larger clusters also have statistically significant p-values.
Here also, we compared our new clustering patterns with those previously observed (table 4). Cluster statistics are presented in table 5. Ten out of 22 species (45.5%) classifications were the same in both the old and new analysis. The four largest clusters have statistically significant p-values at the 5% level. We found one of the same putative clusters as when we re-analyzed the Brusatte data set, a dromaeosaurid cluster and a new cluster of oviraptorids. However, in the re-analysis of this data set, we found that tyrannosaurids form one large cluster instead of two clusters in the re-analysis of the Brusatte data set. This might be due to the selection of characteristics in the individual data sets.
The proximity matrix and the clusters and stats are available online in supplementary file 3 for this analysis.
Table 4. Difference in clustering using the BDIST method and hierarchical clustering for the entropy-filtered van der Reest data set

Table 5. Statistics for the hierarchical clustering for the entropy-filtered van der Reest data set

The Lamanna data set
Lastly, we also re-analyzed the Lamanna data set. For this data set, the Hopkins clustering statistic was 0.739, which is fair clustering quality. Six clusters were determined. The proximity matrix is depicted in figure 4, showing one large cluster with eight species, together with either pairs of species or single species. The large cluster corresponds to an oviraptorid cluster, which was also found in the analysis of the van der Reest data set.

The old and new clustering can be seen in table 6. Twelve out of 15 classifications (80%) were shown to be the same in both the old and new analyses. Cluster statistics can be seen in table 7, showing that only one cluster with more than two members was determined, and has a statistically significant p-value. The proximity matrix and the clusters and stats are available online in supplementary file 4.
Table 6. Difference in clustering using the BDIST method and hierarchical clustering for the entropy-filtered Lamanna data set
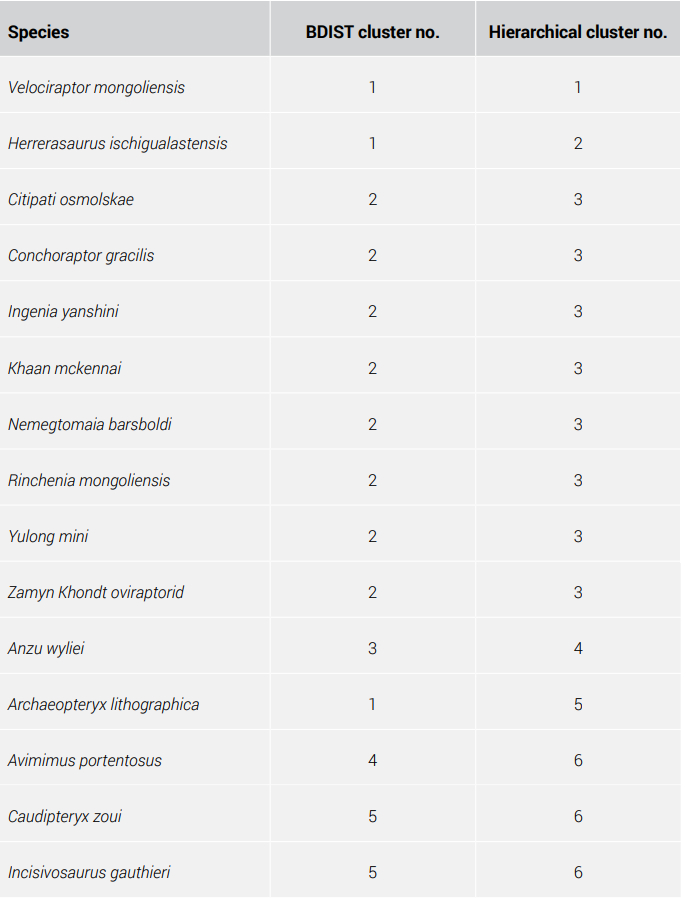
Table 7. Statistics for the hierarchical clustering for the entropy-filtered Lamanna data set

Discussion
In our current study, we re-analyzed three dinosaur data sets from a previous analysis which employed entropy filtering, but which still gave obviously incorrect results (i.e. lumping A. lithografica together with dromaeosaurs). In order to correct these results, the BDIST pipeline was modified. Thus, a large-scale morphology data set for 188 bird species was entropy-filtered, used as input for the BDIST algorithm, and the resulting distance matrix was transformed into a proximity matrix, which was then subjected to hierarchical clustering. This method corrected the over-clustering, which was present in the BDIST results of both the initial, raw results as well as even the entropy-filtered BDIST results.

The present analysis succeeded in properly classifying the incorrect classifications coming from our previous analysis of the three dinosaur data sets. We observed a total of seven novel putative baraminic relationships based on the clustering we found in our results (depicted in figure 5). These are the tyrannosaurids (all species put together), dromaeosaurids, troodontid 1, oviraptor 1, therapod 2, ornithomimid, and Archaeopteryx, which includes A. lithografica and A. huxleyi.
In all three studies A. lithographica does not cluster with Bambiraptor feinbergi, Deinonychus antirrhopus, Herrerasaurus ischigualastensis, and Velociraptor mongoliensis. These dromaeosaurids consistently form a cluster in all three modified data sets. None of the latter four fossils have feather impressions or keratin signatures associated with them. Inferences based on A. lithografica anatomy strongly suggest that at the very least, it is a gliding bird, if not fully capable of flight. In particular, the classic defining bird trait is feathers, and Archaeopteryx’s asymmetrical feather impressions24 and feather protein remnant signatures25 are consistent with flight-capable remiges for the extinct creature.
However, the lack of a keel in Archaeopteryx implies a much smaller pectoralis major muscle than modern powered-flight birds such as the passerines. Why would a bird have feathers to fly but no muscles to power flight? From a creationist perspective it shows design features for gliding, not for flying. The modern roadrunner (Geococcyx) may approximate the form and function of Archaeopteryx. However, Geococcyx has no wing claws. Whereas Geococcyx uses terrain to elevate itself, perhaps Archaeopteryx used its wing claws and other features in more arboreal settings. Like roadrunners, once elevated, the bird could glide downward. This again supports the idea that certain characters should be given more weight than others. For example, with birds, the presence of feathers should have much more weight than the size of bones, which can be up- or down-scaled genetically.
In the van der Reest study, A. lithografica clustered together with Anchiornis huxleyi. Both of these species have a similar wing structure, with slender feather shafts, meaning they had similar flight mechanisms.26 In contrast, Confuciusornis sanctus has elongated primary feathers, with short covert feathers, resembling modern birds.27
Nine species all make up a larger cluster, throughout the three studies: Citipati osmolskae, Conchoraptor gracilis, IGM100-42 unnamed oviraptorid, Ingenia yanshini, Khaan mckennai, Nemegtomaia barsboldi, Rinchenia mongoliensis, Yulong mini, and Zamyn Khondt. All of these are oviraptors, which are theropod dinosaurs with shortened, toothless skulls.28-30
Gallimimus bullatus, Ornithomimus edmontonicus, Sinornithomimus, and Struthiomimus altus all cluster together. They are all members of the theropod family of dinosaurs called Ornithomimidae. Mei long and Gobivenator mongoliensis are both troodontids. Anzu wyliei and Avimimus portentosus belong to separate oviraptor baramins. Caudipteryx zoui and Incisivosaurus gauthieri are members of the same theropod cluster. However, feathered dinosaur doubter Feduccia and colleagues treated Caudipteryx as a flightless bird, perhaps analogous to flightless cormorants of the Galápagos islands, on the basis of precise arrangement of flight feathers on its hand.31 However feathered it was, its wings were too small for flight, but its robust legs showed possible adaptation to terrestrial habitats.32 Jones et al. noted its anterior centre of mass resembled those of cursorial birds.33 By grouping Caudipteryx among theropods, our modified BDIST method has not captured the separation of Caudipteryx as a bird and not a reptile. This is likely due to the similarities in gross morphology, if not in important details like feathers versus not feathers, between theropod and Caudipteryx anatomy.
Shuvuuia deserti and Sinosauropteryx prima are also theropods but belong to separate clusters. This result compares well with the assignment of Sinosauropteryx to the compsognathid dinosaurs particularly on the basis of papulose skin scale—not feather—preservation on its tail.34 Chiappe also grouped Compsognathus with Velociraptor among theropods based on its cursorial anatomy and curved, serrated teeth that birds do not have.35
Lastly, there is a discrepancy between the way tyrannosaurids are classified according to the Brusatte and the van der Reest data sets. Whereas the re-analysis of the van der Reest data puts Allosaurus fragilis and Sinraptor into the same baramin as Tyrannosaurus rex, the Brusatte re-analysis puts them into a separate cluster, together with Guanlong and Dilong paradoxus. It could be that the two data sets were put together using different characters, or there may be more than one tyrannosaurid baramin. This is not uncommon, since previous baraminology studies have predicted multiple turtle and squid baramins.36,37
In contrast with the tyrannosaurids, this study successfully predicted the dromaeosaurid, oviraptor, and Ornithomimidae clusters in the re-analysis of the three data sets. This means that the modified algorithm finds more consistent results than the BDIST method alone.
Conclusion
Baraminology studies may sometimes give results that might intuitively seem incorrect. For example, in the previous analysis of three dinosaur data sets, Archaeopteryx lithografica was classified as a member of a terrestrial dinosaur baramin, when it has anatomy for flight. From the Bible, we know that birds were created on separate days than terrestrial dinosaurs, therefore they must belong to separate baramins. Feathers also provide a clear anatomical separation of Class Aves from Class Reptilia. Applying the extended entropy filter + the hierarchical clustering algorithm to the BDIST method corrected this. Furthermore, this method may be used as a possible tool in order to predict putative baramins more accurately.
References and notes
- McLain, M.A., Petrone, M., and Speights, M., Feathered dinosaurs reconsidered: new insights from baraminology and ethnotaxonomy; in: Whitmore, J.H. (Ed.), Proceedings of the Eighth International Conference on Creationism, Creation Science Fellowship, Pittsburgh, PA, p. 508, 2018. Return to text.
- Turner, A.H., Makovicky, P.J., and Norell, M.A., Feather quill knobs in the dinosaur Velociraptor, Science 317(5845):1721, 2007. Return to text.
- Sarfati, J., Feathered dinos: no feathers after all! J. Creation 26(3):8–10, 2012. Return to text.
- DePalma, R.A., Burnham, D.A., Martin, L.D., Larson, P.L., and Bakker, R.T., The first giant raptor (Theropoda: Dromaeosauridae) from the Hell Creek Formation, Paleontological Contributions 2015(14):1–16, 2015. Return to text.
- Jasinski, S.E., Sullivan, R.M., and Dodson, P., New Dromaeosaurid dinosaur (Theropoda, Dromaeosauridae) from New Mexico and biodiversity of Dromaeosaurids at the end of the Cretaceous, Scientific reports 10(1): 2020. Return to text.
- Feduccia, A., Riddle of the Feathered Dragons, Yale University Press, New Haven, CT, p. 258–59, 2012. Return to text.
- Tay, J., Feathered pterosaurs: ruffling the feathers of dinosaur evolution, J. Creation 33(2):93–98, 2019. Return to text.
- Robinson, D.A. and Cavanaugh, D.P., A Quantitative approach to baraminology with examples from the catarrhine primates, CRSQ 34(4):196–208, 1998. Return to text.
- Wood, T.C. and Murray, M.J., Understanding the Pattern of Life: Origins and organization of the species, Broadman & Holman, Nashville, TN, 2003. Return to text.
- Kimes, P.K., Liu, Y., Hayes, D.N., and Marron, J.S., Statistical significance for hierarchical clustering, Biometrics 73(3):811–821, 2017. Return to text.
- Cserhati, M., Baraminology data filtering method based on entropy measurement and its application in dinosaur and cephalopod data sets, J. Creation 33(3):55–65, 2019. Return to text.
- Brusatte, S.L., Lloyd, G.T., Wang, S.C., and Norell, M.A., Gradual assembly of avian body plan culminated in rapid rates of evolution across the dinosaur-bird transition, Current Biology 24:2386–2392, 2014. Return to text.
- van der Reest, A.J. and Currie, P.J., Troodontids (Theropoda) from the Dinosaur Park Formation, Alberta, with a description of a unique new taxon: implications for deinonychosaur diversity in North America, Canadian J. Earth Sciences 54(9):919–935, 2017. Return to text.
- Lamanna, M.C., Sues, H.D., Schachner, E.R., and Lyson, T.R., A new large-bodied oviraptorosaurian theropod dinosaur from the latest Cretaceous of western North America, PLoS ONE 9(3):e92022, 2014 Return to text.
- Cserhati, M., and Tay, J., Comparison of morphology-based and genomics-based baraminology methods, J. Creation 33(3)::49–54, 2019. Return to text.
- Lawson, R.G. and Jurs, P.C., New index for clustering tendency and its application to chemical problems, J. Chemical Information and Computer Sciences 30(1):36–41, 1990. Return to text.
- cran.r-project.org/bin/windows/base/old/3.6.0 Return to text.
- Wood, T.C., BDIST software, v. 1.0. Center for Origins Research and Education, Bryan College, Distributed by the author, 2001. Return to text.
- Wood, T.C., Visualizing baraminic distances using classical multidimensional scaling, Origins (GRI) 57:9–29, 2005. Return to text.
- Lightner, J.K., An initial estimate of avian Ark kinds, ARJ 6 (2013):409–466, 2013. Return to text.
- Ahlquist, J. and Lightner, J.K., Strategies for more clearly delineating, characterizing, and inferring the natural history of baramins I: establishing baraminic status, with application to the order galliformes (class: Aves), CRSQ 56:97–104, 2019. Return to text.
- Livezey, B.C. and Zusi, R.L., Higher-order phylogeny of modern birds (Theropoda, Aves: Neornithes) based on comparative anatomy: I—Methods and characters, Bulletin of the Carnegie Museum of Natural History 37:1–544, 2006. Return to text.
- Cserhati, M. and Alquist, J., Baraminology suggests cryptic relationships among Caprimulgiformes, J. Creation 33(3):66–76, 2019. Return to text.
- Wellnhofer, P., Archaeopteryx: The Icon of Evolution, Verlag Dr. Friedrich Pfeil, München, 2009. Return to text.
- Bergmann, U., Morton, R.W., Manning, P.L., Sellers, W.I., Farrar, S., and Huntley, K.G., Archaeopteryx feathers and bone chemistry fully revealed via synchrotron imaging, Proc. Natl Acad. Sci. USA 107(20):9060–9065, 2010. Return to text.
- Longrich, N.R., Vinther, J., Meng, Q., Li, Q., and Russell, A.P., Primitive wing feather arrangement in Archaeopteryx lithographica and Anchiornis huxleyi, Curr Biol. 22(23):2262–2267, 2012. Return to text.
- Nudds, R.L. and Dyke, G.J., Narrow primary feather rachises in Confuciusornis and Archaeopteryx suggest poor flight ability, Science 328(5980):887–889, 2010. Return to text.
- Yun, C.G., Heyuanninae clade nov., a replacement name for the oviraptorid subfamily “Ingeniinae” Barsbold, 1981, Zootaxa 4671(2):zootaxa.4671.2.11, 2019. Return to text.
- Lee, S., Lee, Y.N., Chinsamy, A., Lü, J., Barsbold, R., and Tsogtbaatar, K., A new baby oviraptorid dinosaur (Dinosauria: Theropoda) from the Upper Cretaceous Nemegt Formation of Mongolia, PLoS One 14(2):e0210867, 2019. Return to text.
- Lü, J., Chen, R., Brusatte, S.L., Zhu, Y., and Shen, C., A Late Cretaceous diversification of Asian oviraptorid dinosaurs: evidence from a new species preserved in an unusual posture, Sci Rep. 6:35780, 2016. Return to text.
- Feduccia, A., Theagarten, L.S., and Hinchliffe, J.R., Do feathered dinosaurs exist? Testing the hypothesis on neontological and paleontological evidence, J. Morphology 266:125–166, 2005. Return to text.
- Talori, Y.S. and Zhao, J-S., Aerodynamics of soft flapping wings of Caudipteryx; in: Yu, H., Liu, J., Liu, L., Ju, Z., Liu, Y., and Zhou, D. (Eds.), Intelligent Robotics and Applications, ICIRA 2019, Lecture Notes in Computer Science, vol. 11742, Springer, Cham, Switzerland, pp. 155–170, 2019. Return to text.
- Jones, T.D., Farlow, J.O., Ruben, J.A., Henderson, D.M., and Hillenius, W.J., Cursoriality in bipedal archosaurs, Nature 406:716–718, 2000. Return to text.
- Lingham-Soliar, T., The evolution of the feather: scales on the tail of Sinosauropteryx and an interpretation of the dinosaur’s opisthotonic posture, J. Ornithology 154:455–463, 2013. Return to text.
- Chiappe, L.M., Climbing Archaeopteryx? A response to Yalden, Archaeopteryx 15:109–112, 1997. Return to text.
- Hennigan, T., An initial estimate toward identifying and numbering the Ark turtle and crocodile kinds, ARJ 7(2014):1–10, 2014. Return to text.
- O’Micks, J., A preliminary cephalopod baraminology study based on the analysis of mitochondrial genomes and morphological characteristics, ARJ 11:193–204, 2018. Return to text.


Readers’ comments
Comments are automatically closed 14 days after publication.