

Journal of Creation 29(2):127, August 2015
Browse our latest digital issue Subscribe
Appendix 3—Optimal number and alignment of 30nt copies within PR.C
Since the 1,287 nt sequence of PR.C lacks a Stop codon, the gene surely could have not undergone huge chaotic rearrangements and inversions over millions of years. Therefore, if PR.C arose from a series of linked 30nt (CGACGCCGCT)3, at least some should be easy to find. Mutations over millions of years would have modified some of the 30nt blocks, but since the ancestral PR.C contained dozens of identical ones, the Needleman–Wunsch algorithm should be able to identify some still fairly intact.
The first step was to determine empirically the optimal number of 30nt repeats which should be used to obtain the best alignment over the entire PR.C region. The alignment program1 was run using the PR.C sequence and various numbers of 30nt blocks. The best result was found using forty 30nt copies (see C in table 1) with 53.3% identity and 30.6% gaps. The location of the putative blocks are boxed in table 2. Examining these linked blocks could give the impression PR.C may have originally consisted of identical 30nts as Ohno proposed, until one realizes that the high G + C proportions and absurd number of gaps introduced by the algorithm permitted the large number of alignments to be possible.
Null hypothesis: origin was pure (CG)n
In Appendix 2 we aligned the first 80 nt positions against thirty randomly generated oligomers 40 nt long, to demonstrate that Ohno’s 30nt does not perform better than chance. Here we aligned the entire PR.C sequence against an absurd putative ancestor consisting of pure CG pairs (table 1, sequence A; alignment: 52.8% identity, 25.5% gaps). Some linked CG pairs are shown in table 2, sequence A. The percent nt alignment was about the same, but considerably fewer indels were needed to optimize the overlap (25.5% vs 30.6%, a relative difference of 16.7%). Indels in genes are expected to be almost always deleterious and alignments requiring many of them are suspect. The null hypothesis cannot be rejected, and the significantly fewer and, on average, shorter gaps for the (GC)n alignment indicate it would have been a superior proposed ancestral candidate for PR.C.
Null hypothesis: origin was pure (CGC)n
After taking the CG pairs throughout PR.C into account, nucleotide C was present in highest proportion in the remaining position, so we aligned pure CGC triplets over the PR.C sequence (table 1, sequence D; alignment: 50.8% identity, 28.0% gaps). Some linked CGC triplets are shown in table 2, sequence D. Once again, fewer gaps needed to be invoked than required by Ohno’s oligomer (30.6% vs. 28.0%). This null hypothesis cannot be rejected.


A: PR.C aligned with (CG)n, where n = 524.
C: PR.C aligned with (CGACGCCGCTCGACGCCGCTCGACGCCGCT)n, where n = 40.
D: PR.C aligned with (CGC)n, where n = 348.
Alignment of optimally packed 30nt vs in sliding windows
As mentioned above, having dozens of initially identical 30nt blocks in PR.C should provide an evolutionary signal still present in PR.C to permit good alignments. The forty nt30 chain represents the best evolutionary candidate for PR.C. We decided to examine the location and number of aligned nucleotides in PR.C in region 1–45 for the first putative 30nt block derived from the maximally packed PR.C (forty 30nts were used) vs what was found using forty position sliding windows (Appendix 2).
From table 3, sequence X, we see that the maximally packed strategy had the most nt matches, 22. This reveals that the alignment algorithm could have done better when using data provided from the sliding windows. However, if PR.C did originate from a chain of 30nt, alignments A–F (based on sliding windows along the PR.C sequence) in table 3 are comparable in quality.
In fact, the five separate gap regions of alignment X required eleven nts, none of which are a multiple of three nts, meaning that each individually would have caused a frame-shift. Alignment F only requires three separate gap regions for a total of four nts, and although it only has 20 instead of 22 perfect alignments, is more reasonable.
Some reflection reveals that a statistical artefact is being played out hundreds of times throughout the whole PR.C sequence: the high number of G and C nucleotides permits many and alternative alignments with the GC-rich 30nt sequence. There is nothing special about Ohno’s 30nt.

X: for PR.C optimally packed with identical 30nts (data from ref. 2). A–F: using 40-nt sliding windows along PR.C (data from sheet ‘Best first Oligomer’).
Null hypothesis: fully random over entire PR.C
Finally, we wondered whether other good candidates could be found in addition to Ohno’s nt30 sequence as an evolutionary starting point. We reused the thirty randomly generated sequences mentioned in Appendix 2 (having a similar proportion of nucleotides as PR.C). For each random sequence we first need to determine the optimal number of repeats to obtain the best alignment over the entire PR.C sequence.
It takes some effort to determine the optimal length of each random sequence, since blocks of different lengths need to be fed into the EMBOSS Needle program individually. We decided to take a short-cut. The sensitivity of the alignment scores was explored using five of the random sequences. We found that finding the optimal length to maximize alignment led to only small improvements compared to using a random string exactly as long as PR.C (average improvement 0.75% in nt alignment and 1% decrease in gaps used). Therefore, a single run was performed using repeats of each for the thirty sequences, replicated to be as long as PR.C. The optimal length was then determined for only the two best random sequences found (table 4).
It might seem surprising that the average alignment, using random sequences not even optimized for length within PR.C, is not much worse than for Ohno’s 30nt oligomer (45.6%, σ = 1.43 vs 53.3% alignment), but the random strings did have, on average, 11.8% more gap content (indels) (42.4% vs 30.6% gaps).

The best from thirty sequences in table 3, labelled Rand_6, compares favourably (48.6% vs 53.3% alignment for the optimal nt30 chain; 37.4% vs 30.6% gaps).
With little effort we could find better semi-random sequences which align at least as well as 30nt by increasing the number of sequences to test and also by constraining to generate more GC pairs from the large portion of independent C and G produced. There is also no reason why the repeat sequence must be 30 nucleotides long, other lengths could be explored, as we did with the doublet GC and triplet CGC.
Since there is no evidence for a PR.C gene being expressed anywhere in nature, and since the leading researchers in the area of nylon-6–related degrading enzymes no longer believe in Ohno’s frame-shift theory, it did not seem justified to invest more time in these statistical studies.
The risk of statistical coincidence
Suppose we believe RAND_6 represents the ancestral sequence for PR.C and wish to claim the fit is comparable to Ohno’s linked oligomers. First, we point out that the total number of gap locations in the alignments are comparable (158 for RAND_6 vs 151 for 30nt). The overall higher percentage gaps in RAND_6 are due to several large indels, which surely are distorting the statistical tests. For example, a huge indel is shown in sequence A in table 4. We could argue that this abnormal, almost 2% of the entire sequence should not be taken into account as gaps, being a one-time evolutionary accident.
Taking only the ‘relevant’ data into acount, using but a single indel reveals 67% overlap of the initial twenty-one nt between RAND_6 and PR.C. Notice how much more convincing this is than Ohno’s sequence at the start of PR.C (sequence B of table 3): seven ad hoc gaps all over the place to force an alignment to work managed to produce only 59% alignment (27/46).
Data cleanup is common before performing statistical studies, and data which is ‘obviously wrong’ often gets discarded, or only those tests which ‘can’t be right’ get repeated, but not those which fit one’s preconceptions. Consider another section in RAND_6, sequence F in table 4: although nuceotide T represents only 14.8% of PR.C, six Ts show up in a row and Ts represent 47% of this fifteen-nt section. This could be rationalized as having been a later evolutionary insertion and that it is distorting the evolutionary signal.
‘Cleaning’ RAND_6 of alleged irrelevant large indels due to ‘later evolutionary distortions’ would permit us to show why our favoured random sequences perform better than blocks of 30nt. The large indel in sequence E seems wrong, given that without it a convincing 81% overlap region results (21/26 nt).

We could continue cleaning up the dataset, and also draw attention to sequences such as C with 61% identity (31/51 nt) which supports the notion of an evolutionary relationship.
We are not seriously proposing there is anything special about RAND_6 of course, but wish to illustrate the need to understand the potential for coincidence, especially when aligning genes with unusually high G + C or A + T proportions.
We could find better random sequence candidates than RAND_6 as evolutionary competitors to Ohno’s linked oligomer. From Information Theory, and the proportions of nucleotides found in PR.C we determined there were 21,287*H = 2.6 x 10727 high probability sequences,8 from which we selected the best of only thirty trials.9 There are many other sequences further than 4σ from the mean10 which have better alignment than the optimal nt30 chain.
Proportion of CG vs GC pairs
The proportion of CG vs GC pairs differs significantly11 along these 1,287 positions of PR.C: CG pairs = 202 and GC pairs = 159. However, for thirty random sequences, also 1,287 nucleotides long, these pairs were randomly distributed as should be and are present in about the same amounts: average CG pairs = 156.0 (range = 139–175, σ = 8.24); GC pairs = 158.9 (range = 142–177, σ = 9.25).12 This data reveals a clear overabundance of CG pairs in PR.C.
Ohno’s nt sequence consists of 60% CG pairs and only 40% GC. Therefore, a fair comparison of 30nt vs randomly generated sequences should have the latter include more CGs, resulti> Seeng in a better overlap for merely statistical reasons.
As a working hypothesis, we propose the ancestral gene was fairly similar to PR.C, with a nucleotide proportion G + C > A + T, and that many GCs were present for regulatory purposes.
Analysis of the putative original polypeptide
Ohno believes that “Three consecutive copies of the decamer should have given the decapeptidic periodicity Arg-Arg-Arg-Ser-Thr-Pro-Leu-ASP-Ala-Ala to the ancestral polypeptide chain.” We will evaluate now whether there is convincing evidence for the pattern RRRSTPLDAA (10-AA) within the translated version of PR.C.
The protein version of EMBOSS Needle13 was used to align multiple copies of 10-AA against the polypeptide coded for by PR.C. The optimal number was found to be forty copies (sequence A, table 6).

Beginning the alignment of (10-AA)40 at the same position as used by (R)374, (position 33 in PR.C) decreases the % identity of (10-AA)40 to 26.6% and raises % gaps to 35.2%. See the main text.
The resulting optimal locations of the 10-AA blocks within the 429-residue sequence are shown in table 7. Examination of the alignments fails to offer persuasive evidence for a polypeptide repeat structure since only 129 of the 429 residues aligned, after inserting 107 indels. Over half of the aligned decamer blocks required one or more residue indels and residues R + A alone accounted for 92/129 of the aligned positions.15 This merely reflects the high C + G content of PR.C, since the codons for these two resides are: R = (AGA, AGG, CGU, CGC, CGA, CGG) and A = (GCU, GCC, GCA, GCG).

We suspected that residues R and A might be present so often in PR.C that many alignments could not fail to be found by coincidence. The proportion of amino acids in PR.C are shown in table 8, confirming our suspicions. Thirty percent of 10-AA consists of R, which is very close to the proportion found in PR.C, and the same applies fairly well to A.

We repeat that this reading frame has not been reported to be translated in any organism, and the alignment on the basis of amino acids seems to merely reflect the high proportion of G + C. Two thirds of the codons for R begin with CG, and we already commented on the unusually high proportion of CG pairs found in PR.C. Finally, another contribution for the presence of more than twice as many R than A is that a third more condons code for it.
Having pointed out above that a chain of CG aligns better with PR.C than 30nt chains do, we will now determine whether 10-AA aligns better than a chain of pure R. The best proportion of R (table 6, sequence B) led to the alignment shown in table 9. After the initial gap, only three regions use an indel at all (ignoring the final five-residue section).
Suppose we wished to argue the progenitor of the protein from PR.C consisted of pure Arginine (R). This is biologically absurd, but Ohno also had no reason to assume that a repeating chain of 10-AAs, put together with no design forethought, would produce anything useful either. We point out that the algorithm should have selected PR.C position 24 instead of 33, as it did for 10-AA (compare tables 7 and 9). This means 10-AA profited from four alignments and ten fewer gaps than the string of R, but the aligned positions in this range for the R were not taken into account.
To permit a fair comparison between both chains (see alignments in tables 7 and 9 to see why this makes sense), we use the same initial gap size for 10-AA and (R)n and begin at position 33 in both cases. Instead of 27.6% identity (based on 129/468 residues) as reported in table 6, we have only 26.7% (based on 125/469). At the same time, the indels increase from 23.1% (based on 108 /468) to 25.2% (based on 118/468).
These necessary corrections accentuate how much better (R)n aligns with PR.C, especially since half as many indels were required as for (10-AA)40 (table 6), and these gaps were located at only two places (vs 24 independent internal gaps for (10-AA)40 placed optimally by the algorithm to force an alignment). One could argue the PR.C gene had simply later undergone two insertions from unknown sources, especially for the first gap, which led to an atypical string of twelve residues lacking an arginine (R).

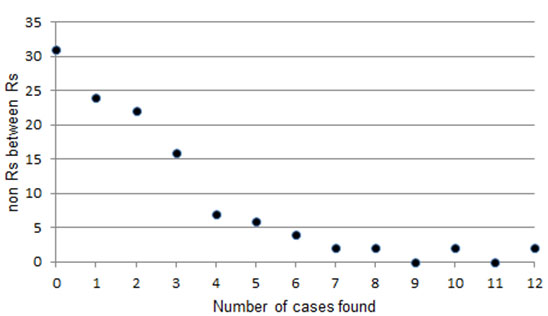
The number of non-R residues between adjacent arginines in the alignment shown in table 9 (non-R mut, for mutations) was analyzed (figure 1).18 118 different non-R muts were found. Consistent with the (absurd) alternative proposal that the ancestral polypeptide consisted of only R residues, non-R mut=0 was found in 31/118 cases (26%). Transformation via very few mutations to alternative residues after over a hundred million years could be argued to have produced non-R muts of lengths between 0 and 3, which represent 79% of the cases. Alternatively, only four cases were found wtih non-R muts of size 9 or greater (which included the largest indel found by the algorithm), and only 8 cases with non-R muts of size 7 or greater. A bioinformatician might interpret these as mutations introduced during evolution (see figure 1).
Our analysis has illustrated the need for more care in accepting claims by Ohno and others that duplicate sequences followed by indels to produce a new reading frame led to new genes (figure 2). Scherer et al. quoted him19 and employed a strategy based on simulated protein sequences to identify 470 human and 108 mouse putative frame-shift events leading to new gene segments. They found no obvious interspecies overlap and interpreted this as a high rate of evolution, whereas ab initio creation or guided mutations20 would be attractive interpretations to explore.
A critical re-evaluation of Scherer’s data is needed before an interpretation can be offered. About half the pairs arose due to frame-shift translations for alternatively spliced variants at a single gene locus: these are not separate genes at all. The original and frame-shifted regions must both produce proteins, or sections of them. Statistical artefacts reflecting non-random nucleotide distributions in regions of chromosomes should be compared against alternative semi-random DNA sequences.
Overlapping codes in both genes might be the correct explanation,21 instead of the creation of new proteins. Hu and Ng warn that indels tend to cluster towards the end of a protein, thereby avoiding nonsense-mediated decay and that identification of indels is prone to sequencing, mapping, and annotation errors, so the real number is likely to be towards the lower end of this range.22

Through deliberate forethought it is certainly possible that much cryptic genetic information has been preloaded into genomes to response to future eventualities. Analysis of this possibility would require deciding which putative gene duplications were actually part of the original design and which arose later. In addition, it must be determined which peptides from frame-shifts do anything biologically useful. A small amount produced by chance may have no theoretical meaning.
Woodmorappe drew attention to the possibility that additional genes producing truncated proteins seem to have been designed for regulatory purposes.
“A second pseudogene may regulate the NOS gene by producing a truncated protein that can bind with the normal protein to produce an inactive heterodimer. Specifically, the active transcription of the pseudogene will lead to the suppression of nNOS protein synthesis, and on the other hand, the inhibition of pseudogene transcription will permit nNOS production.”23
References and notes
- www.ebi.ac.uk/Tools/psa/emboss_needle/nucleotide.html. Return to text.
- See Optimal CG GC nt-30 within PR.C. Return to text.
- See Optimal CG GC nt-30 within PR.C. Return to text.
- See PR.C full seq vs random seqs. Return to text.
- See PR.C aligned with Rand_6. Return to text.
- See PR.C originates from Rand_6. Return to text.
- See PR.C aligned with nt-30. Return to text.
- Truman, R. and Heisig, M., Protein families: chance or design? J. Creation 15(3):115–127, 2001. See Info Theory calcs. The number of candidate sequences will be somewhat smaller if we examine optimized string lengths somewhat smaller than PR.C. Return to text.
- PR.C itself will be one of the high probability strings, so if enough random sequences are tested, eventually we’ll even have a perfect fit. Return to text.
- We determined that optimizing the seach string length will improve the fit by about 0.75%. Using data from table VIII, 45.6 + 0.75 + x(1.43) = 53.3, or 4σ.
For the percent gaps, 42.4 – 1.0 – x(2.05) = 30.6, or 6.2σ. Better alignment strings with PR.C should take both the percent alignment and gaps used into account. Return to text. - See Proportion CG and GC in PR.C. Return to text.
- See Create random transposed. Return to text.
- www.ebi.ac.uk/Tools/psa/emboss_needle/index.html. Return to text.
- See Optimal R AA-10 within PR.C. Return to text.
- See Best AA-10 in PR.C. Return to text.
- See C distrib AAs in PR.C. Return to text.
- See Optimal R AA10 within PR.C and Best Nr R in PR.C. Return to text.
- See Best Nr R in PR.C. Return to text.
- Okamura, K., Feuk, L., Marques-Bonet, T., Navarro, A. and Scherer, S.W., Frequent appearance of novel protein-coding sequences by frame-shift translation, Genomics 88:690–697, 2006. Return to text.
- Purdom, G. and Anderson, K., A Creationist Perspective of Beneficial Mutations in Bacteria, answersingenesis.org/genetics/mutations/a-creationist-perspective-of-beneficial-mutations-in-bacteria/, 27 May 2009. Return to text.
- Tomkins, J., Duons: Parallel Gene Code Defies Evolution, www.icr.org/article/7870/. Return to text.
- Hu, J. and Ng, P.C., Predicting the effects of frame-shifting indels, Genome Biology 13:R9, 2012; genomebiology.com/2012/13/2/r9. Return to text.
- Woodmorappe, J., Pseudogene function: regulation of gene expression, creation.com/pseudogene-function-regulation-of-gene-expression. Return to text.
Readers’ comments
Comments are automatically closed 14 days after publication.