

Journal of Creation 34(1):96–101, April 2020
Browse our latest digital issue Subscribe
Do lizards and snakes form separate apobaramins?
Lizards and snakes are both squamate reptiles, meaning they have a unique joint between their jaws as well as scales which they shed in a special manner. Some evolutionists claim that snakes are related to legless lizards, based on superficial morphological similarities. The molecular-based Gene Content Method (GCM) and the morphology-based BDIST methods were combined to analyze a proteomics data set and a morphology data set to determine baraminic relationships. The eight snake and lizard species separated from one another under GCM. Morphological results classified 123 squamate species into 17 baramins (one amphisbaenian, one chameleon, one dibamid, two gecko, two iguana, three lizard, four skink, and three snake baramins), reproducing some results from previous baraminology studies. The present results show that the similarities between snakes and legless lizards are superficial, meaning they are unrelated. Rather, they form their own separate apobaramins.

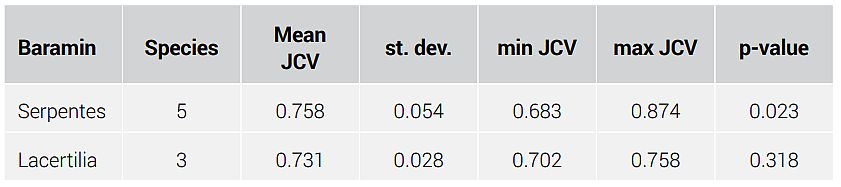
Lizards (Lacertilia) and snakes (Serpentes) are both suborders of squamates, which are reptiles, with a unique jaw joint, and which shed their scaly skin. These two groups have 4,900 and 3,070 living species, respectively, making them the second largest group of terrestrial vertebrates.1 Squamates have a large ecological and medicinal importance.
According to one interpretation of the book of Genesis, the serpent was cursed to crawl on its belly and eat the dust of the earth (Genesis 3:15).2 It is possible that the serpent was originally created with legs. The fact that some snake fossils have been found with reduced limbs corroborates this.3 Multiple lizard species belonging to several families have also undergone limb reduction, such as some skinks (family Scincidae, worm/legless lizards).
The evolution of snakes has been debated for a long time.4 According to some extreme theories, both snakes and varanid lizards (a family that includes monitor lizards and goannas) originate from limbless marine reptiles, such as mosasaurs.5 Some evolutionists claim that legless lizards and snakes are related to one another, based on their long, slender bodies and loss of limbs.
Baraminology is the study of the created kinds mentioned in Genesis 1. The focus of baraminology is to determine the created kind, otherwise known as the baramin. A baramin consists of species which are all related to one another, but unrelated to all other species. An apobaramin is a group which consists of at least one baramin, unrelated to all other species.
Table 1. Main morphological differences between lizards and snakes

If we translate this question to baraminology, do lizards and snakes form a single baramin, or separate baramins? In other words, are squamates members of an apobaramin, containing both lizards and snakes? Suborders Lacertilia and Serpentes are taxa which are higher than the family. In general, baraminologists tend to equate kinds with the family.6 Therefore, it is possible that there may be multiple lizard and snake baramins, if these two suborders indeed turn out to be separate apobaramins. However, the focus of this paper is to examine whether these two groups are separate apobaramins. Table 1 lists differences between lizards and snakes.7
General genomic differences
Reptiles are a very diverse group of organisms, when it comes to genome size, chromosome number, presence of microchromosomes, mitochondrial gene arrangement, and sex chromosome configuration. This alone indicates substantial barriers which divide reptiles into separate apobaramins. For example, in snakes, females exhibit heterogamety (i.e. they carry different sex chromosomes, e.g. X and Y in humans), whereas in lizards, either males and/or females show heterogamety, and in some groups, sex determination is temperature dependent.8
According to mitochondrial studies, snakes have unusual mitochondrial DNA characteristics, such as translocated, truncated tRNA genes and other shortened genes, as well as a second control region (CR) nested between NADH subunits 1 and 2.9 Based on an analysis of the protein-coding genes and the rRNA genes of the mtDNA, Jiang et al. found that lizards and snakes cluster well away from one another.10 Castoe et al. found similar results based on the analysis of the Cytochrome Oxidase I (COI) subunit.11
The ‘venome’ is a term used to describe the repertoire of venom proteins secreted by both lizards and snakes. Transcript studies show that nine types of toxins are shared by both lizards and snakes. These venom proteins are normal proteins, but which adversely affect the physiology of its victim when injected into the bloodstream, as any foreign protein would. Iguanian lizards have venom-secreting glands on both their upper and lower jaws, whereas snakes and anguimorph lizards have lost either their mandibular or maxillary venom glands.12
Interestingly, the front-fanged venom system (where the fangs are placed anteriorly in the upper jaw)13 is known to be present in three snake groups: viperids (rattlesnakes and vipers), atractaspidines (burrowing asps), and elapids (a large group of snakes that includes cobras and sea snakes).1
Previous baraminology studies
Hennigan estimated that there are 41 snake kinds belonging to three families, Boidae (boas), Colubridae (the largest snake family, with 249 genera and approximately 1,700 species), and Viperidae.14,15 Frankhauser and Cumming also found evidence of extensive hybridization within the Colubridae, so the number of baramins in this group is currently indeterminate.16 Wood performed BDIST analysis on the gecko family Pygopodidae, separating two baramins from one another, the two genera Aprasia and Delma.17 This indicates that there could be multiple gecko baramins.
Principle of analysis
Table 2. List of species used in the GCM analysis

Table 3. Results of kmeans clustering based on results from the GCM algorithm
It would be helpful to use molecular baraminology approaches to quantify the differences between lizards and snakes and attempt to identify their baraminic status. For example, there may be important physiological and genomic differences between lizards and snakes which are not visible phenotypically.
The Gene Content Method (GCM)18 was applied to the whole proteomes of three lizard species and five snake species. The green sea turtle (Chelonia mydas) was used as a control. These species are listed in table 2.
A morphology-based baraminology analysis was also performed using an expanded data set containing 192 species and 691 characters assembled by Reeder et al.19 This data set contained species of lizards, snakes, and amphisbaenians, a group of squamates containing species with slender bodies and loss of legs and eyes.
Materials and methods
All supplementary data and figures are available along with a description file on github at github.com/csmatyi/squamates.
The Refseq proteins of three lizard species, five snake species, and C. mydas were downloaded from the NCBI Protein database. These proteomes were run using the OrthoMCL algorithm using default parameters at the Globus Genomics website.20
Data analysis and heat map generation were performed in R (version 3.6.0). K-means clustering was used to partition the species into clusters using the k-means command in R, after setting the algorithm parameter to ‘Forgy’. The Forgy algorithm is a widely used k-means clustering algorithm, which classifies entities based on their minimal distance to k previously determined centroids, each of which represents one of the k clusters. The centroids can be determined by selecting those k entities which are the farthest from one another. In each iterative step, entities are assigned to one of the k centroids, after which the centroids are recalculated.21 To determine the optimal number of clusters, the ‘cluster’ and ‘factoextra’ libraries and the fviz_nbclust command were used, after setting the method parameter to ‘wss’ (weighted sum statistic). Heat maps were constructed using the ‘heatmap’ command, using the ‘average’ clustering method.
The Reeves data set was downloaded from the Dryad website at datadryad.org/stash/dataset/doi:10.5061/dryad.38417. The data set was filtered using the EntropyFilter.R script at github.com/ csmatyi/EntropyFilter.22 The BDIST software version 2.0 was then run on the reduced data set to determine baraminic relationships at coresci.org/ bdist.html.23-25 BDIST was run using a character relevance cutoff of 0.95. The cutree command was used in R to determine baraminic membership in the reduced version of this dataset. Baraminic relationships were visualized with the KiNG (Kinemage, Next Generation) software (64-bit Windows version) available at kinemage.biochem.duke.edu/software/king.php.26 The KiNG file (Cserhati_Reeves_reduced_squamates_king.txt) is also available online at the github address.
Results and discussion
Biblical analysis
Leviticus 11:29–30 mentions several kinds of lizards:
“And these are unclean to you among the swarming things that swarm on the ground: the mole rat, the mouse, the great lizard of any kind, the gecko, the monitor lizard, the lizard, the sand lizard, and the chameleon.” (ESV)
Based on these verses we can suspect that lizards and snakes do indeed belong to different kinds, especially if there are several kinds of lizards, some here even mentioned by name, for example the gecko and the chameleon.
Application of the GCM algorithm

The GCM algorithm was run on the whole proteomes of the nine species included in this study. A Jaccard Coefficient Value (JCV) matrix was derived showing the JCV values for all possible species pairs (figure 1). The JCV value determines the ratio of common ortholog groups divided by the union of all ortholog groups between two species. Values closer to 1 correspond to species more likely to belong to the same baramin. Values closer to 0 correspond to species which likely belong to separate baramins. The JCV matrix is available online at the provided github address (supplementary file 1).
Pre-clustering analysis was performed on the JCV data set. The Hopkins statistic is relatively low (0.595), meaning it is still usable for clustering even though values greater than 0.75 are preferable. In supplementary figure 1, we can see that the optimal cluster number is 4 (as defined by the wss method used by the fviz_nbclust command in R). This suggests that lizards and snakes belong to separate apobaramins. If lizards and snakes belong to the same apobaramin, then the optimal cluster number would be 2 (cluster 1 = the outlier, cluster 2 = lizards + snakes).
Table 4. Clustering of the nine species using kmeans clustering, based on GCM results

Table 5. Baramin statistics for 14 of the 17 predicted baramins from the reduced Reeves data set. Only those baramins are shown which have at least three species.

Figure 1 shows the main result from the GCM algorithm. Tables 3 and 4 show the result of the k-means clustering, along with descriptive statistics. The five snake species cluster well together in the heat map. They also separate well from C. mydas, the outlier species, and the three lizard species. The snake cluster has a p-value of 2.3%, meaning that it is a statistically significant cluster. However, the other cluster, which includes the three lizard species, has a very high p-value > 5% (31.8%). The reason for the poor clustering of lizards could be because the three species which were sampled could possibly belong to separate baramins. Inclusion of more species could clarify whether there are one or more lizard kinds.
Morphological analysis of squamates using the BDIST algorithm
In order to get a more complete picture of the baraminic relationships between different squamate groups, a morphological analysis of a data set of 192 squamate species including lizards, snakes, and amphisbaenians was used, with 691 morphological characters. The species and character values in this data set are available online at github (supplementary file 2).
Since 33.5% of the character values in the data were undetermined (?), data filtering was done using the Entropy Filtering method as described in the Materials and Methods section. The maximum proportion of unknown values per species and per column were both set to 40%, with a minimum entropy value of 10%. After filtering, 5.5% of the characters remained undetermined, leaving 123 species and 409 characters. Data reduction was 2.6-fold.

The BDIST software was run on the reduced data set, with a character relevance cutoff of 0.95. The resulting BDC matrix shows two large groups showing statistically significant continuity within them, and significant discontinuity between them. Snakes separate well from all other squamates used in the data set (supplementary figure 2). A stress plot shows a minimal unscaled stress value of 0.026 at 17 dimensions (supplementary figure 3).
A 3D MDS plot was drawn for the 123 species, which can be seen in figure 2. Four larger groups can be seen in different shades. Serpentes separates well away from all the other species. Gekkota (geckos) and Iguania (iguanas) both form a small group next to a larger cluster, Lacertilia (lizards).
The distance matrix coming from the BDIST analysis was transformed into a proximity matrix by subtracting the distance values from 1 to reflect the proximity of each species to each other. The Hopkins statistic was 0.916, particularly high, meaning that the data set can be clustered very well. An Elbow plot made with the proximity matrix shows that the optimal number of clusters in the data set is four (supplementary figure 4).
A heat map was made from the proximity matrix (figure 3). Here also snakes (lower left) quite visibly separate from all other squamates (upper right). According to the stress plot, the minimum unscaled stress was shown for 17 baramins. Fourteen of the 17 predicted baramins had at least three members. Of these 14, 13 are statistically significant (p-value < 5%). Classification of species into clusters is described more fully in supplementary file 2 online. The statistics for these predicted baramins can be seen in table 5.
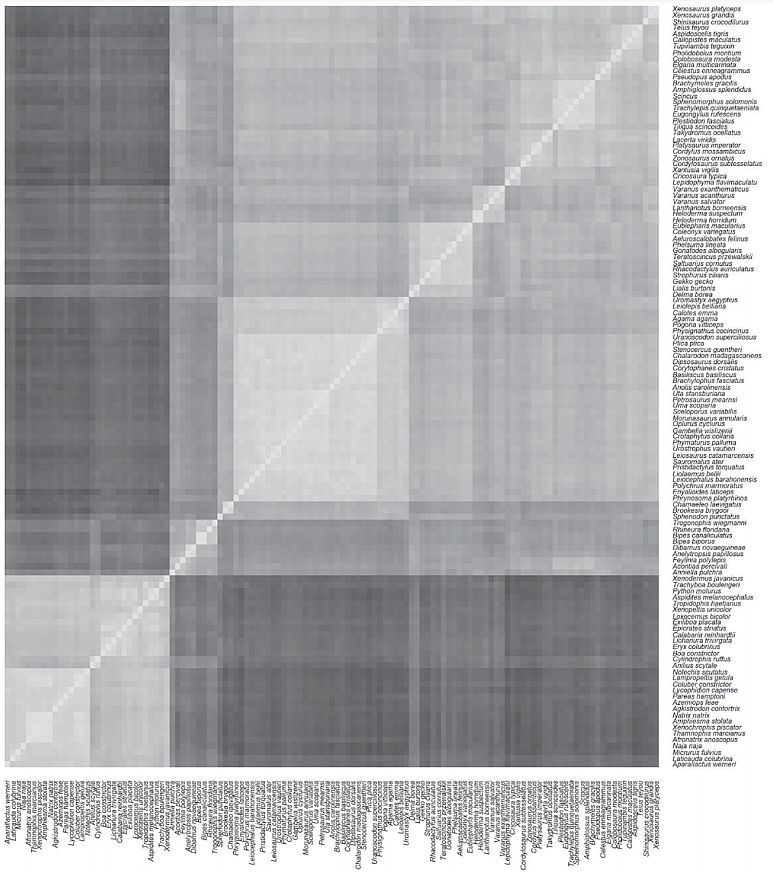
These groups correspond to one amphisbaenian baramin, one chameleon, one dibamid, two gecko, two iguana, three lizard, four skink, and three snake baramins. Among the lizard baramins we have an anguimorph and a varanus baramin, consisting of the family Lacertidae. Interestingly, the baraminic classification of Wood was also partially reproduced, putting the two gecko species Delma borea and Lialis burtonis into the same baramin (cluster #16).
Conclusion
These results are in harmony with previous squamate baraminology studies. The present studies provide further molecular proof that snakes form a well-defined group separate from all other reptiles. Despite superficial resemblance between snakes and legless lizards, snakes and lizards are apparently unrelated. Thus, snakes and lizards can be comfortably classified into their own separate apobaramins. Multiple snake and lizard baramins also indicate that, as opposed to humans, God could have created several baramins which closely resemble one another (i.e. multiple snake ‘kinds’), but further studies are required to work out their exact relationships.
References and notes
- Vidal, N. and Hedges, S.B., The molecular evolutionary tree of lizards, snakes, and amphisbaenians, C. R. Biol. 332(2–3):129–139, 2009. Return to text.
- Sarfati, J., The Genesis Account: A theological, historical, and scientific commentary on Genesis 1–11, Creation Book Publishers, Powder Springs, Georgia, USA, pp. 360–361, 2015. Return to text.
- Bell, P., Standard snake evolution story stymied by spate of fossil discoveries, J. Creation 29(3):8–10, 2015. Return to text.
- Hsiang, A.Y., Field, D.J., Webster, T.H., Behlke, A.D., Davis, M.B., Racicot, R.A., et al., The origin of snakes: revealing the ecology, behavior, and evolutionary history of early snakes using genomics, phenomics, and the fossil record, BMC Evol. Biol. 15:87, 2015. Return to text.
- Lee, M.S., Molecular evidence and marine snake origins, Biol. Lett. 1(2):227–230, 2005. Return to text.
- Wood, T.C., The current status of baraminology, CRSQ 43:149–158, 2006. Return to text.
- Sodera, V., One small speck to man, the evolution myth 2, Bekaam Printers, Malaysia, 2009. Return to text.
- Janes, D.E., Organ, C.L., Fujita, M.K., Shedlock, A.M., and Edwards S.V., Genome evolution in Reptilia, the sister group of mammals, Annu. Rev. Genomics Hum. Genet. 11:239–264, 2010. Return to text.
- Dong, S. and Kumazawa, Y., Complete mitochondrial DNA sequences of six snakes: phylogenetic relationships and molecular evolution of genomic features, J. Mol. Evol. 61(1):12–22, 2005. Return to text.
- Jiang, Z.J., Castoe, T.A., Austin, C.C., Burbrink, F.T., Herron, M.D., McGuire, J.A., Parkinson, C.L., et al., Comparative mitochondrial genomics of snakes: extraordinary substitution rate dynamics and functionality of the duplicate control region, BMC Evol. Biol. 7:123, 2007. Return to text.
- Castoe, T.A., Jiang, Z.J., Gu, W., Wang, Z.O., and Pollock, D.D., Adaptive evolution and functional redesign of core metabolic proteins in snakes, PLoS One 3(5):e2201, 2008. Return to text.
- Fry, B.G., Vidal, N., Norman, J.A., Vonk, F.J., Scheib, H., Ramjan, S.F., Kuruppu, S., et al., Early evolution of the venom system in lizards and snakes, Nature 439(7076):584–588, 2006. Return to text.
- Vonk, F.J., Admiraal, J.F., Jackson, K., Reshef, R., de Bakker, M.A., Vanderschoot, K., van den Berge, I., et al., Evolutionary origin and developmentof snake fangs, Nature 454(7204):630–633, 2008. Return to text.
- Hennigan, T., An initial investigation into the baraminology of snakes: order—Squamata, suborder Serpentes, CRSQ 41:153–160, 2005. Return to text.
- Hennigan, T., An initial estimate toward identifying and numbering extant Tuatara, amphisbaena, and snake kinds, ARJ 7:31–47, 2014. Return to text.
- Frankhauser, G., and Cumming, K.B., Snake hybridization; in: Snelling, A.A. (Ed.), A Case for Intrabaraminic Diversity, Proceedings of the Sixth International Conference on Creationism 467–483, Creation Science Fellowship, Pittsburgh, PA, 2008. Return to text.
- Wood, T.C., Animal and Plant Baramins, in Issues in Creation Series, no. 3, Wipf and Stock, Eugene, OR, pp. 85–87, 2008. Return to text.
- O’Micks, J., Baraminology classification based on gene content similarity measurement, CRSQ 54(1):27–37, 2017. Return to text.
- Reeder, T.W., Townsend, T.M., Mulcahy, D.G., Noonan, B.P., Wood Jr, P.L., Sites Jr, J.W., et al., Integrated analyses resolve conflicts over squamate reptile phylogeny and reveal unexpected placements for fossil taxa, PLoS One 10(3):e0118199, 2015. Return to text.
- Madduri, R.K., Sulakhe, D., Lacinski, L., Liu, B., Rodriguez, A., Chard, K., Dave, U.J., et al., Experiences building Globus Genomics: a next-generation sequencing analysis service using Galaxy, Globus, and Amazon Web Services, Concurr. Comput. 26(13): 2266–2279, 2014. Return to text.
- Morissette, L. and Chartier, S., The k-means clustering technique: general considerations and implementation, Mathematica, Tutorials in Quantitative Methods for Psychology 9(1):15–24, 2013. Return to text.
- Cserhati, M., Baraminology data filtering method based on entropy measurement and its application in dinosaur and cephalopod data sets, J. Creation 33(3):55–65, 2019. Return to text.
- Robinson, D.A., and Cavanaugh D.P., A quantitative approach to baraminology with examples from the primates, CRSQ 34:196–208, 1998. Return to text.
- Wood, T.C., Visualizing baraminic distances using classical multidimensional scaling, Origins (GRI) 57:9–29, 2005. Return to text.
- Wood, T.C., BDISTMDS software, v. 2.0. Center for Origins Research, Bryan College, USA, 2008. Return to text.
- Chen, V.B., Davis, I.W., and Richardson, D.C., KiNG (Kinemage, Next Generation): a versatile interactive molecular and scientific visualization program, Protein Sci. 18(11):2403–4039, 2009. Return to text.


Readers’ comments
Comments are automatically closed 14 days after publication.