

Journal of Creation 34(2):8–11, August 2020
Browse our latest digital issue Subscribe
The pre-Flood world resembled Pangaea

Secular geologists have inferred several pre-Pangaea supercontinents, including Greater Gondwana or Pannotia (involving mostly the southern continents) and before that Rodinia. Greater Gondwana (Pannotia) is the so-called transitional continental configuration between Pangaea and Rodinia. Pangaea is claimed by secular scientists to have formed about 350 Ma years ago, Greater Gondwana about 500 Ma ago, and Rodinia about 900 Ma ago.1
Debate exists over the best pre-Flood continental configuration, with some creation scientists advocating for an initial created supercontinent called Rodinia that many accept was centred at the South Pole.2 We have advocated for something close to Pangaea and have it centred closer to the equator.3 John Baumgardner has introduced a slight twist to the debate, in an attempt to explain the paleomagnetic data. He chose to call the pre-Flood configuration Pannotia, but in fact it closely resembles Pangaea in its configuration.4 However, he placed his pre-Flood Pannotia close to the South Pole, similar to the location of Rodinia.4
In our research on the pre-Flood world, we used a slightly modified Pangaea configuration because it has the most empirical geological evidence supporting it, including the best fit of the modern continents, especially across each side of the Atlantic Ocean.5 We placed a narrow sea (300–500 km) between North America and Africa/Europe, allowing for limited plate subduction, an early Flood closure of the pre-Atlantic, and the formation of the Appalachian/Caledonian mountain belts.6 We included this pre-Atlantic sea based on subducted plate remnants that diminish beneath the Appalachians below 300 km, which support this narrow-sea interpretation.7
Baumgardner has recently suggested a slight variation on the two dominant pre-Flood configuration models.8 He acknowledges that the
“ … vast number of paleomagnetic determinations made over the past 70 years point overwhelmingly to the conclusion that the continental regions now in the northern hemisphere, especially Europe and North America, were located not far from the south magnetic pole when their early Paleozoic igneous rocks crystallized.”8
However, he further acknowledged that the paleomagnetic data is not diagnostic in itself, and that either 1) the magnetic pole of the pre-Flood world could have moved about 110° northward along today’s prime meridian early in the Flood, or 2) the continents themselves moved 110° along this same path early in the Flood.8 Both of these solutions would satisfy the observable paleomagnetic data. Other than that, his Pannotia configuration closely resembles Pangaea, with an already intact Gondwana.4
Of these two scenarios, we propose the first scenario is more likely, that only the magnetic field migrated rapidly northward in the early Paleozoic (early Flood), leaving the physical continents close to their pre-Flood configuration near the equator, barring some initial plate motion. This suggests that the magnetic poles may have been close to the equator prior to the Flood or had rapidly migrated to that position at the onset of the Flood event. The continents themselves did not have to move rapidly in this interpretation, just the magnetic poles did.
However, the question about which pre-Flood configuration to use remains unresolved. Should it be more like Rodinia or Pangaea? Should it be centred at the equator or centred at the South Pole? We attempt to answer these questions by examining some unusual Late Precambrian rocks found in southern Asia and the Middle East. We also assess the amount of new seafloor required in each model and finally test our reconstruction against a fossil assemblage recently discovered in Antarctica.
Precambrian salt better fits Pangaea
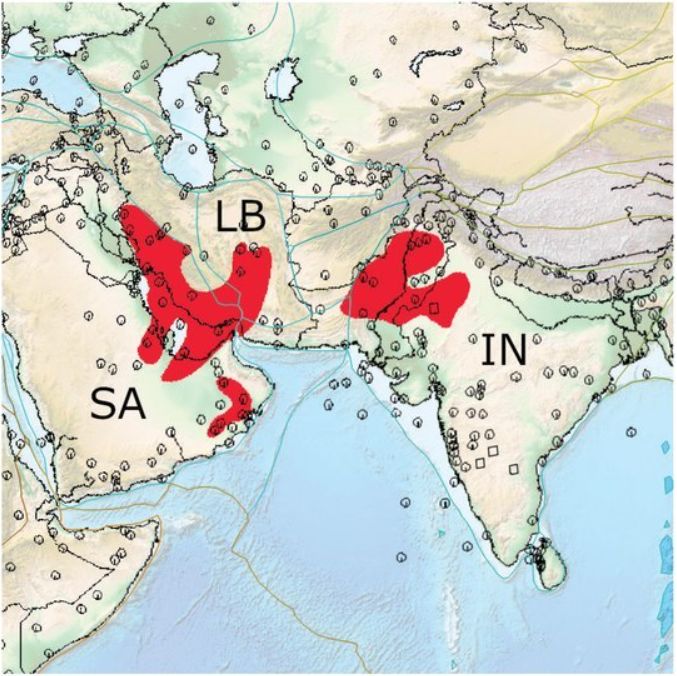
We have recently mapped out the extent of a massive amount of Precambrian salt-rich rocks in the Middle East, Pakistan, and India (figure 1). This salt bed extends from the Persian Gulf (Hormuz Evaporates) to Pakistan (Salt Range Formation) to western India (Hanseran Evaporates).9-11 These various salt-rich units have been conventionally dated as Neoproterozoic, falling in the age range of 540–950 Ma years old.9,10 The Salt Range Formation has been described as a mass of unstratified halite with occasional thin dolomite beds, capped by both gypsum and anhydrite.9 These various formations vary between 1,800 and 3,000 m thick, including the non-halite units.9
Finding thick salt-rich layers in rocks prior to the Cambrian is rather unusual globally. Exactly why these salt-rich rocks formed in a Flood model just prior to the Sauk Megasequence is still unclear. As these Precambrian salt-rich rocks are claimed by secular geologists to be approximately the same age as Rodinia, we can use their extent to test the validity of the Rodinia reconstruction. In other words, do the salt deposits fit the Rodinia reconstruction?
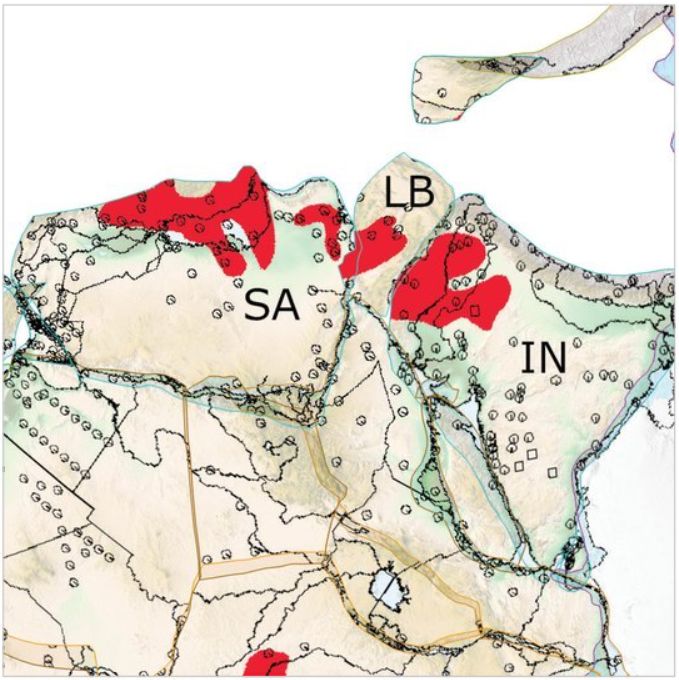
Figure 1 shows the current extent and thicknesses of the salt-rich layers across the Middle East and southern Asia. Figure 2 shows the reconstructed Precambrian salt-rich formations when placed in a configuration similar to Pangaea. Figure 3 shows the approximate locations of these same salt deposits in a Rodinia reconstruction. After examining these maps, it seems quite clear that the Pangaea (including the Greater Gondwana or Pannotia) reconstruction is the better fit. This reconstruction places the salt-rich rocks in the same approximate location spanning the north-eastern Saudi Arabian Peninsula and the subcontinent of India. Unfortunately, Greater Gondwana and Pangaea are very similar in the Southern Hemisphere, so it is difficult to differentiate the two. Nonetheless, they are both good matches of the Precambrian salt-rich units in the Middle East, Pakistan, and India (figure 2).
The claimed older Rodinia configuration shows a poor match of the salt deposits across this region (figure 3). Admittedly, it is possible that there may have been multiple random locations of salt deposition simultaneously in various locations of the globe at the time of deposition. However, the simplest, and usually the best solution to explain these salt deposits is that they formed in the same approximate location at the same time.
We conclude that Pangaea (at least the southern part called Gondwana) was already in existence when these massive Neoproterozoic salt-rich rocks were being deposited. This finding confirms and validates our earlier pre-Flood continental interpretation for the pre-Flood world that used a modified Pangaea.6 Rodinia is merely a secular uniformitarian hypothesis that doesn’t conform well to the actual rock data.
Rodinia requires too much oceanic crustal subduction
Another reason we favoured a Pangaea located near the equator is the youthfulness of the modern oceanic crust. The denser pre-Flood oceanic crust was nearly completely consumed by subduction during the Flood. Rapid seafloor spreading created a completely new and lower density oceanic crust (lithosphere really) as a consequence. It was the density contrast between the heavier, colder, original oceanic crust (the lithosphere) and the underlying less dense and hotter mantle that allowed the runaway subduction process to proceed. The density difference served essentially as the ‘fuel’. Geophysicist John Baumgardner described it as “gravitational energy driving the motion” of the plates.12

The global stratigraphic data we have compiled indicate only a limited rise in sea level occurred during the early Paleozoic.13 These strata are the least extensive in terms of volume, surface area, and average thickness compared to the later Mesozoic and Cenozoic deposits.14 These data indicate that runaway subduction only began in selected locations first, like along the edge of the pre-Atlantic Ocean and possibly in the western Pacific. Early Paleozoic strata were likely caused by tsunami-like waves that went crashing across vast shallow seas that existed in the pre-Flood realm.3,6 Later in the Flood, we see stratigraphic evidence that runaway subduction and catastrophic seafloor spreading were operating on a more massive scale, spreading sediments across even more extensive areas of the continents including the highest hills.13,14 The newly created oceanic lithosphere served to push up the seafloor until the tsunami waves were able to circumvent the globe at the end of the Mesozoic. There was no geophysical means or reason to stop the catastrophic plate motion until the original oceanic lithosphere was fully consumed. At that moment, the newly created, more buoyant lithosphere ceased subducting, bringing plate motion to a virtual standstill. As a result, we only witness small residual plate motions of centimetres per year today.
A pre-Flood world that resembled Rodinia (or Pannotia), centred at the South Pole, would have required nearly all the oceanic crust to be consumed twice. The first time would have been during the breakup of Rodinia, moving the continents into the configuration of Pangaea. The later split of Pangaea would have required a second episode of near-complete consumption of the oceanic crust to produce the current global configuration. Geophysically, the first breakup of Rodinia and reconfiguration into Pangaea would be possible, but it would also have consumed all the denser pre-Flood oceanic crust in the process. A second move would then be rendered nearly impossible since any significant amount of new oceanic crust created (to break up Rodinia) would not have the necessary density contrast to fuel a second episode of subduction (to break up Pangaea). As mentioned above, it is the consumption of the cold, more dense pre-Flood oceanic crust that caused runaway subduction in the first place.12 Therefore, if there had been a Rodinia, we would still be in a Pangaea continental configuration today.
Testing the Pangaea-like configuration with fossils
Recently, a drilling ship extracted a core from West Antarctica’s Amundsen Sea, finding fossils claimed to be from an ancient rainforest.15 The sediment in the core was dated between 84–94 Ma old, placing it in the Cretaceous System.15 Secular plate reconstructions at the presumed time place this part of Antarctica very close to the South Pole, at about 82°S latitude.15
How could a temperate rainforest exist this close to the South Pole and survive through 4+ months of darkness each year? Even in a Flood model, there are equally baffling climate questions if other pre-Flood configurations are used instead of Pangaea. A configuration like Rodinia places Antarctica and most of the continents near the South Pole.2 This leaves much of the continental mass in total darkness for several months each year, assuming a tilt to the earth was in effect to mark the seasons (Genesis 1:14).
In contrast, our Pangaea-like configuration has these Antarctic plant fossils growing near 45°S latitude in the pre-Flood world, about the equivalent to southern New Zealand today.6 These Cretaceous plants were simply buried near their place of origin, later in the Flood, as the waters were reaching their zenith across the globe.16 Not surprisingly, these same types of trees and flowering plants are found in modern-day New Zealand. As Ashley Strickland reported: “The forests were similar to those now found on New Zealand’s South Island, the researchers said.”17
Concluding thoughts
A lush, temperate rainforest near the South Pole is not a mystery if a Pangaea-like pre-Flood supercontinent was in existence since Creation Week. These plants were simply growing in a pre-Flood mid-latitude location, far from the South Pole, and then were rapidly moved to their present position during the catastrophic plate activity of the Flood. These rainforests never did grow near the South Pole.
In summary, a pre-Flood Pangaea-like configuration best explains the fit of the Precambrian salt deposits in the Middle East/Asia and similarly, makes the most sense of the recent discovery of the Cretaceous rainforest found in Antarctica. And it can explain the paleomagnetic data by assuming only a magnetic polar wander, and not a mechanical wander.
References and notes
- Campbell, I.H. and Allen, C.M., Formation of supercontinents linked to increases in atmospheric oxygen, Nature Geoscience 1(8):554–558, 27 July 2008 | doi:10.1038/ngeo259. Return to text.
- Snelling, A.A., Geological issues: Charting a scheme for correlating the rock layers with the biblical record; in: Boyd, S.W. and Snelling, A.A. (Eds.), Grappling with the Chronology of the Genesis Flood, Master Books, Green Forest, AR, pp. 77–109, 2014. Return to text.
- Clarey, T., Assembling the pre-Flood World, Acts & Facts 47(4), 2018; icr.org/article/assembling-pre-Flood-world. Return to text.
- Baumgardner, J., Understanding how the Flood sediment record was formed: the role of large tsunamis; in: Whitmore, J.H. (Ed.), Proceedings of the Eighth International Conference on Creationism, Creation Science Fellowship, Pittsburgh, PA, pp. 287–305, 2018. Return to text.
- Clarey, T.L., Empirical data support seafloor spreading and catastrophic plate tectonics. J. Creation 30(1):76-82, 2016. Return to text.
- Clarey, T.L. and Werner, D.J., Use of sedimentary megasequences to re-create pre-Flood geography, in: Whitmore, J.H. (Ed.), Proceedings of the Eighth International Conference on Creationism, Creation Science Fellowship, Pittsburgh, PA, pp. 351–372, 2018. Return to text.
- Schmandt, B. and Lin, F.-C., P and S wave tomography of the mantle beneath the United States, Geophysical Research Letters 41(18):6342–6349, 2014; agupubs.onlinelibrary.wiley.com | doi:10.1002/2014GL061231. Return to text.
- Baumgardner, J., personal communication, 28 April 2020. Return to text.
- Kadri, I.B., Petroleum Geology of Pakistan, Pakistan Petroleum Limited, Karachi, Pakistan. pp. 46–52, 1995. Return to text.
- Hughes, N.C., Myrow, P.M., Ghazi, S., McKenzie, N.R., Stockli, D.F., and DiPietro, J.A., Cambrian geology of the Salt Range of Pakistan: linking the Himalayan margin to the Indian craton, GSA Bulletin 131(7/8):1095–1114, 2019. Return to text.
- Awasthi, A.K. and Ananad, A., Megascopic, petrographic and SEM-EDX studies of halite bearing Eocambrian sequence of Hanseran Evaporite Group (HEG), western Rajasthan, India. Indian J. Geosciences 72(3):215–226, 2018. Return to text.
- Baumgardner, J., Numerical modeling of the large-scale erosion, sediment transport, and deposition processes of the Genesis Flood, ARJ 9:1–24, 2016; answersingenesis.org/geology/sedimentation/numerical-modeling-large-scale-erosion-sediment-transport-and-deposition-processes-genesis-flood/. Return to text.
- Clarey, T.L. and Werner, D.J., the sedimentary record demonstrates minimal flooding of the continents during Sauk deposition, ARJ 10:271–283, 2017; answersingenesis.org/geology/rock-layers/sedimentary-record-demonstrates-minimal-flooding-continentsduring-sauk-deposition/. Return to text.
- Clarey, T., Carved in Stone: Geological Evidence of the Worldwide Flood, Institute for Creation Research, Dallas, TX, pp. 194-311, 2020. Return to text.
- Klages, J. Salzmann, U., and the Science team of PS 104, Temperate rainforests near the South Pole during peak Cretaceous warmth, Nature 580:81–86, 2020. Return to text.
- Clarey, T., Carved in Stone: Geological evidence of the worldwide Flood, Institute for Creation Research, Dallas, TX, pp. 153–179, 2020. Return to text.
- Strickland, A. Evidence of ancient rainforests found in Antarctica, CNN World, cnn.com/2020/04/01/world/antarctica-ancient-rainforest-scn/index.html, 1 April 2020. Return to text.


Readers’ comments
Comments are automatically closed 14 days after publication.