

Journal of Creation 23(2):110–117, August 2009
Browse our latest digital issue Subscribe
Transposon amplification in rapid intrabaraminic diversification
Transposons are wide-spread mobile genetic elements that make up a huge part of the genomes of species. They are so named because of their ability to jump from one place in the genome to another. Often, they are given whimsical names, such as gypsy, Mariner, Tourist, or Pack-MULEs, which reflect their mobility. Barbara McClintock discovered the existence of these elements after witnessing the phenotypical change they brought about after jumping around in the maize genome. Due to evolutionary bias, transposons have generally been regarded as parasitic “junk DNA”, using the host’s genetic machinery to propagate. However, the actual functionality, diversity, and high abundance of transposons justify a revision of this viewpoint. Such rapid transposon accumulation puts the mechanisms for rapid speciation (given a recent creation and subsequent Flood-induced genetic bottleneck) into a new perspective, and may lead to a further development of a scientific basis for baraminological research. This paper deals with the distribution and dispersal of transposons in the light of evolutionary models as well as a creationist reinterpretion. Some calculations of transposition rates are given which support recent creation and rapid intrabaraminic variation. The importance of transposons is discussed in regard to mapping baramin life-histories.
Transposons in general

In the higher species (eukaryotes), two basic types of transposons can be distinguished: Class I and Class II. Class I transposons replicate through an RNA intermediate, and are therefore called retrotransposons. Many of them end in sequences known as long terminal repeats (LTRs), and are located in areas where recombination between genes takes place. Members of Class I are short and long interspersed nuclear elements (called SINEs and LINEs, respectively); these make up a major part of the repetitive elements present in eukaryotic genomes. Class I transposons are usually located further away from the coding region of genes than the Class II transposons. LINEs can contain ORFs (open reading frames) from a few genes, such as reverse transcriptase or integrase, and are capable of transposing autonomously. They end up in LTRs. SINEs are much shorter elements which do not contain any coding sequences. Alu elements are examples of SINEs.
Class II, or DNA transposons replicate autonomously, using their own genes and proteins to copy their own sequences, and insert themselves into other parts of the genome. In this way they are capable of moving parts of the host’s genome along within themselves. They are located closer to genes (for example MITE sequences in cereal genomes) as opposed to Class I type transposons. Class II transposons can be divided into many different families and subfamilies, and bear names such as Activator, Mutator, or Helitron. Class II transposons are present in a few hundred or thousand copies per genome at most, and are sparser than Class I type transposons.1-5 Basic types of transposon elements are depicted in table 1.
Why transposons are a problem for evolutionary theory
Introductory thoughts on the effects of transposons on the genome
The naturalistic view of life assumes that the first “simple” genome of a living organism emerged from a chemical soup. Through selectable mutations accumulated over several billion years, this original genome evolved into all the intricate genomes we observe today. However, genome research in the past 10 years presents a picture of a far more dynamic genome that has been shaped and sculpted to a significant degree by transposable elements.6 We can see in table 2 that transposons make up a large percent of the genomes of different organisms.
Table 2. Genome sizes and content of repetitive
elements in some well-known organisms.
For example, evolutionists claim the maize genome acquired virtually all retrotransposons (which make up about 80% of the maize genome: see table 1) in the last 6 million years.3 This statement is quite profound. First, it raises a question related to species stability. If it really took 6 million years for the maize genome to quadruplicate in size, then how could acquiring such a great quantity of genetic material keep maize the same species for such a long time? Maize was derived from teosinte, a plant hardly recognizable as modern maize. Teosinte was domesticated by the Amerindians over the past few thousand years, making rapid diversification by intelligent selection a more plausible explanation as to how the maize genome changed in such a way.
Evolutionists contend that, as in the case of transcription factor binding sites, random base substitutions can cause the appearance and disappearance of regulatory sequence elements. With transposons inflating the genome in such a manner, large chunks of raw genetic material would appear out of which new kinds of genes or other genetic elements could be formed. This is similar to how Arabidopsis is supposed to have acquired a major part of its genes. 60% of BAC sequences covering 80% of the Arabidopsis genome were found to contain duplicated segments, but yet it remained the same species.7
Since it is commonly accepted that transposons rapidly spread within the genome after colonizing the germ line (when the delicate developmental program is active), this is strongly discouraging to the idea that transposons are only harmful in their phenotypic effect. Actually, some functions of transposons can be assigned to repetitive elements; for example, certain structural functions and recombination sites, as well as genome rearrangement through transpositioning of genetic elements. Transposons can also react to abiotic stresses by regulating expression patterns of genes through cis-regulatory elements inserted by moving transposons.8 Other functional examples include induction of alternative splicing, or changing the expression patterns in certain tissues or even the subcellular location of proteins.9 It looks as though researchers will have to rethink the “junk DNA” theory10).
The concept that transposon-induced gene inflation is not only not producing junk DNA, but that it is also beneficial and strategic could be taken a step further. An interesting technique for studying the phenotypic effect of multiple genes has been developed in recent years by a Canadian research team involving the synthesis of a mammalian artificial chromosome (MAC) construct. It has been shown that MAC constructs persisted stably throughout several mouse generations. The interesting thing here is that even with the MAC carrying a whole array of novel genes (each with a potential to severely affect the phenotype) the mice are expected to remain mice. The researchers do not predict that they will evolve into a new species!11,12
Lacking observational evidence, evolutionists can always fall back on the argument that such acquisitions of raw genetic material may indeed give rise to new species and claim that “ … the rice genome would be, in effect, ‘the wheat genome without the repetitive sequences’.”3 This implies that changes in the transposon content are sufficient to give rise to new species. However, this would still not answer how the coding regions of the wheat/rice genome came about; it only deals with regulatory or contextual changes.13-15 A study done by Kalendar et al. dealing with the copia-type BARE-1 retrotransposon in barley shows that transposable elements can spread rapidly in response to microclimatic divergence.16 In this study, the copy numbers of BARE-1 ranged from 8,300 to 22,100 per haploid barley genome within a 400 m long gorge at Evolution Canyon in Mount Carmel, Israel. Such changes surely could not have taken millions of years because the wild barley that was studied exhibited retrotransposon replicative spread variability assumed to be correlated to sudden stress due to microclimate variations within the gorge and other climatic factors.


Evolutionary models dealing with the rate of transposition state that the distribution of transposons within host genomes can take place in short “bursts”, the accumulative effect of which could eventually lead to “genomic obesity”. Afterward, genetic material could be slowly lost (although the mechanism remains unclear). It is reasonable to propose that unequal cross-over recombinations or deletions of different sizes may be the underlying mechanism. If so, larger genomes could be expected to contain transposons younger than those in smaller genomes, because the latter could already be diminished in size due to deletions.
A study by SanMiguel in 1998 dealing with a number of plant species (such as Arabidopsis, rice, lotus, sorghum, maize, barley and diploid wheat) showed that even by evolutionary standards the studied retrotransposons are all thought to be about the same age.17 It should be noted, however, that the age of the LTR sequences is calculated by the gamma-corrected Kimura 2 method and depends on the substitution rate of nucleotides in the LTR sequences. In this model, the age of an LTR sequence is calculated from the substitution rate, but the substitution rate is based on the estimated time to the divergence between the species. It is an obvious case of circular reasoning.17,18-23
The number of LTR sequences in barley was also shown to correlate with altitude and temperature.24 Parallel to this, the differences in the repetitive content of the wheat/rice genome could shed light on how intrabaraminic variation could occur, as these two species belong to a single holobaramin.25 Considering these observations, it is clear that a mechanism to induce rapid variation makes more sense in a creationist framework (where new species arise almost instantly) than in the evolutionary model (where it supposedly takes hundreds of thousands of years for novel species to arise).
Consequently, it would be a stretch of the imagination that different species persisted for millions of years without having their genomes affected. For example, genome size variation has been observed within the progeny of Helianthus annuus, where the difference in genome size was 14.7%. This would mean 441 Mb (which is larger than the genome of rice itself!) of the 3,000 Mb genome of sunflower.26 With many thousands of copies of transposons within the genome, genomes should have grown quite quickly during a very short period relative to the evolutionary timescale. Contrary to this, evolutionists estimate that according to gene loss models, it would take around 1.5 billion years for maize to get rid of the same amount of this excess genetic material.27
Model of transposon accumulation in genomes
Transposons are capable of adding large tracts of DNA to the genome, and it would be of great importance to formulate a mathematical model describing the rate of transposon amplification within a genome. The model presented below is completely hypothetical in nature. Research is required to elucidate the exact way in which transposons accumulate and may validate or reject the proposed model.
Since the numbers of new transposons which arise within the genome are proportional to the number of transposons capable of replicating themselves, we may say that

That is, the rate of spread of transposons n’(t) within the genome is proportional to the function f(t) of the number of transposons n(t) capable of replicating after t transposition events. From this we can deduce that

where n(t) is the number of transposons after t transposition events, C’ is a constant, and F(t) is the primitive function of the function f(t) which is characteristic of the rate of transposon accumulation within the genome.
From this we may deduce one of two possible things. If the primitive function F(t) of f(t) is constant, that is

meaning that the number of transposons in a genome after t transpositions grows exponentially. If so, it would lead to an exponential explosion relatively quickly. This would lend support to the creationist model, which predicts large numbers of transposons accumulating in genomes only recently (that is, with a short period of time allowed for accumulation to occur). It would also be in line with evidence from other fields of science that support the recent creation/worldwide Flood model (for example: high mutation rates are observed, yet the number of mutations that have occurred since mitochondrial Eve is too small if we assume long ages; also extremely high rates of radioactive decay are suggested by the creationist RATE team).28,29
In the evolutionary framework, the model implies a runaway / out of control accumulation of transposons in the genome a long time ago. Since we see genomes still intact, this means that runaway transposon accumulation has not yet occurred in the relatively short time since creation.
However, if the function f(t) is not constant, then the rate of transposon accumulation may change during time. A further investigation of the function f(t) reveals important characteristics about the dynamics of transposon accumulation. We know that the lower and upper bounds of the function f(t) are 0 and ln 2, respectively:

The lower bound 0 would mean a complete stasis in the accumulation of transposons within the genome, resulting in no increase; i.e. no transposition and/or amplification. Therefore, f(t) is always greater than zero. Since after any t number of transposition events the maximum number of transposons within the genome is n(t) = 2t , then

If we take the function f(t) to decay exponentially, we get

However, when the variable t (= transposition events) increases, e-gt/g decreases and tends to decline to 0. The remaining function n(t) = eht, however, still describes an exponential growth of transposon copy acquisition. However, if in equation 6 h is equal to 0, we arrive at an equation for a sigmoidal curve. According to this model, transposon accumulation lags off after an exponential burst in a later phase. This means that after an initial burst phase of transposon accumulation, a lag phase follows, characterized by a shutdown of transposon activity. This is noteworthy, because it fits with certain aspects of the AGEing hypothesis of Todd Wood,30,31 who contends that genetic rearrangement occurred during a certain period of time after the Flood in the genomes of organisms to allow the rapid phenotypic change necessary for adaptive dispersal via genetic variation.
In figure 1 we can see a hypothetical situation where the number of transposons is calculated as a function of transposition events. The equation n(t) = 100000 •e–e–1 (if we assume that g = 1) gives a sigmoidal curve of the form n(t) = a •e–e–1, where e–e–1 ranges from 0 to 1. Therefore, a would denote the maximum number of transposons in the genome.
The obvious question is that if the number of transposons has already reached a plateau, then how long has this plateau condition persisted? Evolutionists could argue that it has continued for an indefinitely long time. This would mean that all transposon activity has had ample time to shut down completely. Contrary to this, some transposons have been shown to be active in a number of organisms, such as humans.27,32 However, very few plant retrotransposons have been shown to be transcriptionally active (one is BARE-1 in barley).1,8,33 MITE sequences in plants have not been shown to excise, except for the rice mPing element, also indicative of their low transposase activity.1,9
This would mean that we are presently at the top shoulder of the sigmoidal curve, where transposon activity is slowly dying out. This is marked by the presence of many defective transposon sequences within genomes.
The importance of transposons in baraminology studies
Many repetitive sequences are either species or genera specific in bacteria, plants and animals, and are thought to promote speciation.34 This is good news for baraminologists, since transposons can therefore be used as a sort of signature to identify members of a baramin. This would mean that transposons could be used as a diagnostic tool to determine whether or not a species is a member of a given baramin.
By counting the number of the various transposons in the genomes of different species that belong to the same baramin, we can get a picture of the life history of a given baramin. In other words, by following the change in the number of a given transposable element, we can estimate which species originated from a particular baranome (see refs.14 and 15). For example, particular MITE sequences can be found at the same position in the genomes of different plant genomes because of their relative stability.1 Therefore MITEs can be used as landmark or reference sequences to mark the inflation or change of a certain baranome. Also, the BARE-1 transposon element is widespread and specifically found in a number of grass species (such as wheat, rye and oats), each with slightly diverged sequence, whereas it is absent in other species. This may indicate that BARE-1 is a baramin-specific transpoable element.24 A similar diagnostic transposon element is the RIRE-1 element in rice.1
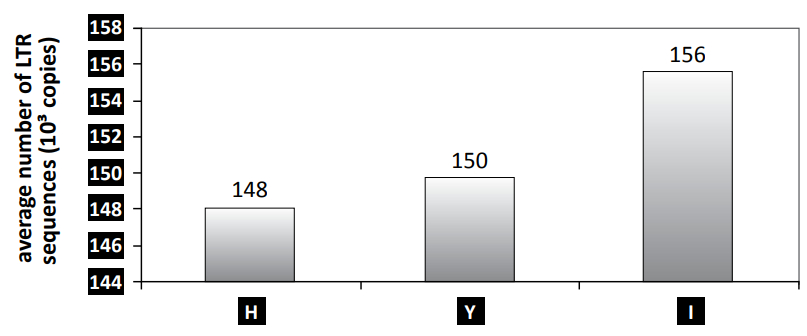
The number of BARE-1 elements in a genome can be approximated by the number of LTR, in and rt sequences within the genome. According to Vicient et al.,33 the number of copies of these element decreases in the Y, H and X genomes of different barley species (Hordeum spp.) as compared to the I genome of barley, and may reflect the spreading of the transposon during the life history of the Hordeum monobaramin (see figure 2). In the genus Hordeum, the I genome is the most representative of barley, and contains the most sequences. The Y, H and X genomes are characteristic of other barley species, and contain a decreasing number of these elements, Y having the highest. Furthermore, Vicient et al. also found that genome size was negatively correlated (r = –0.593) to genetic distance from barley, meaning that the genomes of the Hordeum species may have inflated parallel to their acquisition of transposable elements.

Table 3 is a list of barley species with different types of genomes (H, Y and I) and the 1,000s of LTR sequences they contain, which are supposedly equal to the number of BARE-1 transposons in the genome. In addition, table 3 shows that barley genomes roughly fall into three groups: group I contains the highest number of LTR sequences; group Y has an intermediate number of LTR sequences; and group H has the lowest number.
According to mainstream evolutionists, the wheat genome equals the rice genome but without the repetitive elements. Since transposon activity adds large tracts of DNA to the genomes of organisms, and because they do not easily back-mutate, transposons may be a tool to track back the “life-history” of baramins. For the rice and wheat genomes, which belong to the same baramin,30 it would be an interesting endeavour to map species relationship as a function of transposon content.

In this respect it is interesting to determine whether species with the same gene content and colinearity all classify as members of the same holobaramin. For example, microcolinearity has been shown to exist between certain parts of the genome in rice and members of the tribe Triticeae, even though the distance between genes may be up to at least sevenfold.35 Similarly, species with about the same transposon content may be members of the same monobaramin, such as species in the genus Hordeum, which show intrabaraminic (and even intraspecies) variation. The nature and degree of variation would obviously be helpful in determining ancestry. In contrast, species with the same gene colinearity but with different transposon content could be members of different monobaramins. This is because different numbers of transposon would have accumulated after speciation occurred.
Because of the widespread dispersion and conserved LTR termini, molecular studies such as REMAP (Retrotransposon-Microsatellite Amplification Polymorphism) and IRAP (Inter-Retrotransposon Amplified Polymorphism) may be useful tools in tracking the spread of transposons within baramins.36 Given their large difference in genome size, rice and wheat could be members of different monobaramins. Moreover, species in a given baramin with small genome size could be members of the archebaramin, representing the original state of the baranome before the amplification process started. This model is presented in figure 3.
The life history of a baramin undergoing transposon amplification is analogous to an uninflated balloon on which a number of dots/bars are drawn and connected to each other by lines (see figure 4). The dots represent different genes, whereas the lines represent the intergenic spaces. Inflating the balloon is analogous to an increase in transposon content: The further the dots move from each other on the surface of the balloon, the greater the length of the intergenic regions become.
This is in accord with a study in rice, sorghum, and maize, which showed significant differences in a certain segment of the Adh1-F locus between the three species, although the genes in this region were mainly colinear. In this case, homologs of the Adh1 and u22 genes were 50 kbp apart in sorghum, but 120 kbp apart in the larger maize genome. The gene density in this region was approximately one gene per 9–12 kbp in rice and sorghum, whereas the density was one per 30–80 kbp in maize, which shows intrabaraminic variation due to transposon amplification.37 This shows that determination of gene colinearity in related species such as cereals could be of great help in exploring the boundaries of baraminology.38,39 Furthermore, microcolinearity of genes is proof of a young age for plant species since, if they really are millions of years old according to evolution, then the order of their genes should have become scrambled past recognition.
When gene colinearity was studied between Arabidopsis (Brassicaceae) and rice, it was found that ESTs (expressed sequence tags) from rice had very low homology with genes on the chromosomes of Arabidopsis, even at the protein level. This was interpreted by our evolutionary friends to indicate that the genomes of the both plants had “eroded” too much for a successful comparison. In other words, gene colinearity and order were unrecognizable.40 In a separate study of rice, wheat and Arabidopsis, researchers found that out of 46 types of rice copia elements, only two (Adena and Osr8) were present in Arabidopsis, and even the Osr8 element was thought to be in silico contamination.41 Similarly, a computer analysis of Tourist and Stowaway rice short inverted-repeat elements in the non-coding regions of 413 Arabidopsis genes failed to identify a single repeat longer than 30 bp.9 It is most interesting to note that Moore et al. have found that the genomes of a number of grass species can even be circularized (formed into a circle) around one another and divided into 19 colinear rice linkage segments that are all representative of the ancestral grass genome (in our case the genome of the archebaramin).42 This mode of representation of the genomes of a single monobaramin may even be adapted to all baraminology.
Furthermore, when comparing mammalian and plant transposons, we find that SINEs and LINEs are more common to mammalian genomes, whereas MITEs and LTR retrotransposons are more common to plant genomes. We can take these transposons as marker elements common to the mammalian and plant apobaramins, respectively. These would be examples of baramin-specific transposable element markers.
Creationists could interpret this observation to support the notion that colinearity of genes is evidence of interbaraminic relationships; for example, lack of colinearity of genes between Arabidopsis and rice demonstrates the discontinuity between the monocot grasses and dicot Brassicaceae, thereby assigning these two plant groups to separate baramins.
Conclusion
The process of genome expansion by means of transposable elements as observed in several plant species shows that genomes can be moulded quite dynamically without crossing evolutionary boundaries. Contrary to mainstream assumptions, the expansion of genomes via transposon amplification is much faster than anticipated by the evolutionary model. Neither is the type of speciation of the kind that is required to evolve from microbe to man. In addition, the rapid spread of transposable elements within these genomes shows that genomes are recent. Variation induced by accumulation of transposable elements and fast-track speciation events are very rapid phenomena and fit nicely with the biblical timescale. A large number of transposable elements also give support to the Wood model of rapid baraminic diversification after the Flood followed by subsequent widespread deactivation. Furthermore, the distribution of certain transposable elements shows that they can be used as marker elements in baraminology studies. Considering the increasing body of evidence that transposable elements induce variation in baranomes, and may even be involved in post-Flood speciation events, they should be renamed variation-inducing genetic elements (VIGEs; as proposed by Terborg, ref. 14).
Glossary |
|
| BAC sequence: | bacterial artificial clone. |
| Copia element: | a common type of retrotransposon with retrovirus-like sequence organization. |
| EST: | expressed sequence tags used to determine gene transcripts. Usually short in length, covering only part of a gene. |
| gag/prt/pol/env proteins: | a number of proteins coded for by Class II type transposons and which are necessary for transposition. |
| Gamma-corrected Kimura two method: | a substitution model for calculating genetic distances between DNA sequences. |
| in sequence: | a domain within the BARE-1 element encoding the integrase protein and needed for replication. |
| LTR: | long terminal repeat—a type of sequence belonging to LINEs and involved in the insertion of the transposon. |
| MITE: | miniature inverted-repeat transposable element: short transposon of several hundred bps which are restricted in transposition. May contain genetic regulator elements. |
| ORF: | open reading frame—that part of a gene which can be potentially translated into peptides/proteins. |
| rt sequence: | a domain within the BARE-1 element encoding the reverse transcriptase protein and needed for replication. |
Acknowledgments
I would like to thank Aladár Pettkó-Szandtner and Levente Bendegúz Szűk for their critical reading of the manuscript as well as Tamás Varga for his help in describing the mathematical model behind transposon accumulation. I would also like to thank Eszter Cserháti for proofreading the text.
References
- Casacuberta, J.M. and Santiago, N., Plant LTR-retrotransposons and MITEs: control of transposition and impact on the evolution of plant genes and genomes, Gene 311:1–11, 2003. Return to text.
- Mao, L., et al., Rice transposable elements: a survey of 73,000 sequence-tagged-connectors, Genome Res 10(7):982–990, 2000. Return to text.
- Moore, G., Cereal chromosome structure, evolution, and pairing, Annu Rev Plant Physiol Plant Mol Biol 51:195–222, 2000. Return to text.
- Bureau, T.E. and Wessler, S.R., Mobile inverted-repeat elements of the Tourist family are associated with the genes of many cereal grasses, Proc Natl Acad Sci USA 91(4):1411–1415, 1994. Return to text.
- Bureau et al., A computer-based systematic survey reveals the predominance of small inverted-repeat elements in wild-type rice genes, Proc Natl Acad Sci USA 93(16):8524–8529, 1996. Return to text.
- Terborg, P., Evidence for the design of life: part 2 Baranomes, Journal of Creation 22(3)68–76, 2008. Return to text.
- Simillion, C., et al., The hidden duplication past of Arabidopsis thaliana, Proc Natl Acad Sci USA 99(1):13627–13632, 2002. Return to text.
- Takeda, S. et al., Transcriptional activation of the tobacco retrotransposon Tto1 by wounding and methyl jasmonate, Plant Mol Biol 36:365–376, 1998. Return to text.
- Wessler S.R., Transposable elements associated with normal plant genes, Physiologia Plantarum 103:581–586, 1998. Return to text.
- Brosius, J., How significant is 98.5% “junk” in mammalian genomes? Bioinformatics 19(Suppl 2):II35, 2003. Return to text.
- Lindenbaum, M., et al., A mammalian artificial chromosome engineering system (ACE System) applicable to biopharmaceutical protein production, transgenesis and gene-based cell therapy, Nucleic Acids Res 32(21):e172, 2004. Return to text.
- Vanderbyl, S.L. et al., Transgene expression after stable transfer of a mammalian artificial chromosome into human hematopoietic cells, Exp Hematol 33(12):1470–1476, 2005. Return to text.
- Cserhati, M., Creation aspects of conserved non-coding sequences, Journal of Creation 21(2):101–108, 2007. Return to text.
- Terborg, P., The design of life: part 3 an introduction to variation-inducing genetic elements, Journal of Creation 23(1):99–106, 2009. Return to text.
- Terborg, P., The design of life: part 4 variation-inducing genetic elements and their function, Journal of Creation 23(1):107–114, 2009. Return to text.
- Kalendar, R., et al., Genome evolution of wild barley (Hordeum spontaneum) by BARE-1 retrotransposon dynamics in response to sharp microclimatic divergence, Proc Natl Acad Sci USA 97(12):6603–6607, 2000. Return to text.
- SanMiguel, P., et al., The paleontology of intergene retrotransposons of maize, Nat Genet 20(1):43–45, 1998. Return to text.
- Kimura, M., Estimation of evolutionary distances between homologous nucleotide sequences, Proc Natl Acad Sci USA 78(1):454–458, 1981. Return to text.
- Hartl, D.L. et al., Modern thoughts on an ancyent marinere: function, evolution, regulation, Annu Rev Genet 31:337–358, 1997. Return to text.
- Hartl, D.L., et al., What restricts the activity of mariner-like transposable elements, Trends Genet 13(5):197–201, 1997. Return to text.
- Bennetzen, J.L., Transposable elements, gene creation and genome rearrangement in flowering plants, Curr Opin Genet Dev 15(6):621–627, 2005. Return to text.
- Bennetzen, J.L., et al., Mechanisms of recent genome size variation in flowering plants, Ann Bot (Lond) 95(1):127–132. 2005. Return to text.
- Miskey, C., et al., DNA transposons in vertebrate functional genomics, Cell Mol Life Sci 62(6):629–641, 2005. Return to text.
- Vicient, C.M., et al., Variability, recombination, and mosaic evolution of the barley BARE-1 retrotransposon, J Mol Evol 61(3):275–291, 2005. Return to text.
- Wood, T.C., A baraminology tutorial with examples from the grasses, Journal of Creation (Journal of Creation) 16(1):15–25, 2002. Return to text.
- Turpeinen, T., Genome size variation in Hordeum spontaneum populations, Genome 42:1094–1099, 1999. Return to text.
- Gregory, T.R., Insertion-deletion biases and the evolution of genome size, Gene 324:15–34, 2004. Return to text.
- Gibbons, A., Calibrating the mitochondrial clock, Science 279(5347):28–29, 1998. Return to text.
- Humphreys, R., Nuclear decay: evidence for a young world, Impact 352:1–4, 2002. Return to text.
- Wood, T.C., The AGEing process: rapid post-Flood intrabaraminic diversification caused by altruistic genetic elements (AGEs), Origins 53:5–34, 2002. Return to text.
- Wood, T.C., Perspectives on AGEing, a young-earth creation diversification model, Proceedings of the Fifth International Conference on Creationism, pp. 479–490, 2003. Return to text.
- Bennett, E.A., et al., Natural genetic variation caused by transposable elements in humans, Genetics 168(2):933–951, 2004. Return to text.
- Vicient, C.M., et al., Retrotransposon BARE-1 and Its Role in Genome Evolution in the Genus Hordeum, Plant Cell 11(9):1769–1784, 1999. Return to text.
- McFadden, J. and Knowles, G., Escape from evolutionary stasis by transposon-mediated deleterious mutations, J Theor Biol 186(4):441–447, 1997. Return to text.
- Chen, M., et al., Microcolinearity in sh2-homologous regions of the maize, rice, and sorghum genomes, Proc Natl Acad Sci 94:3431–3435, 1997. Return to text.
- Vicient, C.M., et al., Structure, functionality, and evolution of the BARE-1 retrotransposon of barley, Genetica 107(1–3):53–63, 1999. Return to text.
- Bennetzen, J.L., Grass genomes, Proc Natl Acad Sci USA 95:1975–1978, 1998. Return to text.
- Gale, M.D. and Devos, K.M., Comparative genetics in the grasses, Proc Natl Acad Sci USA 95(5):1971–1974, 1998. Return to text.
- Rabinowicz, P.D. and Bennetzen, J.L., The maize genome as a model for efficient sequence analysis of large plant genomes, Curr Opin Plant Biol 9:149–156, 2006. Return to text.
- Devos, K.M. et al., Arabidopsis–rice: will colinearity allow gene prediction across the eudicot–monocot divide? Genome Res 9(9):825–829, 1999. Return to text.
- Wicker, T. and Keller, B., Genome-wide comparative analysis of copia retrotransposons in Triticeae, rice, and Arabidopsis reveals conserved ancient evolutionary lineages and distinct dynamics of individual copia families, Genome Res 17(7):1072–1081, 2007. Return to text.
- Moore, G., et al., Grasses, line up and form a circle, Cereal Genome Evolution 5(7):737–739, 1995. Return to text.


Readers’ comments
Comments are automatically closed 14 days after publication.