

Journal of Creation 25(3):115–120, December 2011
Browse our latest digital issue Subscribe
Does observational evidence indicate the universe is expanding?—part 2: the case against expansion
Evidence is presented against cosmological expansion that involves both the angular size and surface brightness of galaxies as a function of redshift. Also the cosmic microwave background radiation is discussed, its temperature as a function of redshift as well as the fact that foreground shadows are not found to be cast by galaxy clusters as would be expected if the big bang model was correct. Finally, absorption line systems are discussed in terms of evidence both for and against expansion.
The conclusion is reached that the observations can be used to describe either a static universe (where the Hubble Law results from some as-yet-unknown mechanism) or the expanding universe described by the standard big bang Λ cold dark matter model. In the latter case, size evolution of galaxies is invoked necessarily to get the cosmology to conform to the observations. The simple non-expanding Euclidean universe fits most data with the least number of assumptions. From this review it is apparent that there are still many unanswered questions in cosmology and it would be a mistake to base one’s theology on any particular cosmology.
Evidence against expansion
Angular size test
The test of the dependence of the angular size of some astronomical sources as a function of redshift was first conceived by Fred Hoyle.1 In principle, it is simple, but in application not so simple, because of the difficulty in finding a ‘standard rod’, a type of object with no evolution in linear size over the lifetime of the universe. The angular sizes of QSOs (quasi-stellar objects or quasars) and radio galaxies at radio wavelengths, for first-ranked cluster galaxies in the optical, and for the separation of brightest galaxies in clusters, or in QSO-galaxy pairs of the same redshift have all been measured.2 (Ref. 2 provides an excellent analysis of this and the Tolman surface brightness test. See also the references contained therein.)
This type of test is related to the Tolman surface brightness test but tests for the angular size (θ) of an object as a function of epoch (z). This will vary quite noticeably depending on the cosmology assumed. The angular sizes of radio galaxies over a range up to z = 2 show a dependence θ ∝ z−1,3,4 which is a static Euclidean effect over all scales. Size evolution as a function of redshift is needed for this to fit the standard model.
In the standard model evolution in object size is assumed and generally is used to make up for any deficiency between the modelled and observed sizes as a function of redshift. Any discovered θ ∝ z−1 dependence, as predicted by a static Euclidean universe, would be just a fortuitous coincidence of the superposition of the angular size θ(z) dependence in the expanding universe with evolutionary and/or selection effects. However, the fit of radio source counts was found to be best when no evolution was assumed.5 López-Corredoira2 found that, if assuming the standard cosmological model as correct, the average linear size of galaxies, with the same luminosity, is six times smaller at z = 3.2 than at z = 0, and their average angular size for a given luminosity is approximately proportional to z−1.
Neither the hypothesis that galaxies which formed earlier have much higher densities nor their luminosity evolution, nor their merger ratio, nor massive outflows due to a quasar feedback mechanism are enough to justify such a strong size evolution. Without a very strong size evolution the standard model is unable to fit the angular size vs redshift dependence. This requires between two and four major mergers per galaxy during its lifetime, which is observationally unjustifiable. Also it is not known how local massive elliptical galaxies have grown, as similar-sized galaxies are known at high redshift. Therefore it follows that the nearby ones must have been much smaller at high redshift assuming size evolution to be true. And no method is known whereby spiral galaxies grow through mergers and preserve their spiral disk nature.
Some disk galaxies have been found that have no nuclear bulge; they are considered to be almost too good to be true.6 Kormendy et al. (2010) ask the question: “How can hierarchical clustering make so many giant, pure-disk galaxies with no evidence for merger-built bulges?” Simulations show that as spirals merge, their spiral disk structure is lost. Observations of five brightest cluster galaxies (BCGs) at redshifts 0.8 < z < 1.3 were compared to a group of BCGs at z = 0.2 and found to be no more than 30% smaller, indicating little or no evolution contrary to the standard model.7
As mentioned, the main difficulty with this type of measure is establishing the standard size of the objects being observed. However, the cosmological model that uses a very simple phenomenological extrapolation of the linear Hubble Law in a Euclidean static universe fits the angular size vs redshift dependence quite well, which is approximately proportional to z−1. There are no free parameters derived ad hoc, although the error bars allow a slight size/luminosity evolution. The type 1a supernovae Hubble diagram can also be explained in terms of this model with no ad hoc fitted parameter, i.e. no dark matter nor dark energy.
Tolman surface brightness
In 1935 Hubble and Tolman8 proposed the so-called Tolman test based on the measure of the brightness of galaxies as a function of epoch. A galaxy at redshift z differs in the surface brightness depending on whether there is recession or not. The choice of units determine the redshift dependence, and in bolometric units the surface brightness of identical objects varies by (1+z)4: one (1+z) factor due to time dilation (a decrease in photons per unit time), one factor (1+z) from the decrease of energy per photon and two factors from the fact that the object was closer to us by (1+z) when the light was emitted. In an expanding universe, regardless of the units the ratio of surface brightness in an expanding and non-expanding universe is (1+z)−3. This is independent of wavelength.
Lerner9 tested the evolution of galaxy size hypothesis, the ‘catch-all’ used to make the standard model fit the angular size of galaxies as a function of redshift. His method is based on the fact that there is a limit on the ultra-violet (UV) surface brightness of a galaxy, because when the surface density of hot bright stars, and thus supernovae increases, large amounts of dust are produced that absorb all the UV except that from a thin layer. Further increase in surface density of hot bright stars beyond a given point just produces more dust, and a thinner surface layer, not an increase in UV surface brightness. Based on this principle, there should be a maximum surface brightness in UV-rest wavelengths independent of redshift. Scarpa et al.10 measured in low redshift galaxies a maximum FUV (1550 Å at rest) emission of 18.5 magAB/arcsec2, and no galaxy should be brighter per unit angular area than that. López-Corredoira, using data from Trujillo et al.11 determined surface brightness values for galaxies under the assumptions of both expanding and static universes. They found that in the expanding case many galaxies would have to be brighter than the allowed limit by even up to 6 times. In the case of the static universe no galaxy would be brighter than this limit.
Lerner12 using a large UV dataset of disk galaxies in a wide range of redshifts (from 0.03 to 5.7), which included 3 sets of galaxies at low redshift (z ≤ 0.1) and 8 sets of galaxies at high redshift (0.9 < z < 5.7) from the Hubble telescope Ultra-Deep Field, show that there is a decided preference for a fit to the angular size data with a Euclidean non-expanding (ENE) universe over that of the expanding ΛCDM concordance model. In fact the results are a very poor fit to the ΛCDM model. If the redshift range is restricted to 0.03 < z < 3.5, then the ENE model provides a reasonably good fit. When a very small amount of extinction is allowed for, the fit is near perfect.
The CMB radiation
There are two important issues here in relation to an expanding universe:
- Can we really trust that the cosmic microwave background radiation (CMBR) is from a background source?
- Does measurement of the temperature of that radiation at different epochs tell us something cosmological?
The CMBR was a successful prediction of the standard model (Gamow, in 1948, predicted relic radiation from the big bang) but unless you could show that it could not originate elsewhere, it would not be proven. Lieu, Mittaz and Zhang13 (2006) showed that when 31 relatively nearby clusters of galaxies (where most z < 0.2) were studied for any decrement in temperature, a shadowing of the CMBR by the clusters , it was only detected in 25% of the clusters. They looked for the expected temperature decrement of the X-ray emitting intergalactic medium via the Sunyaev-Zel’dovich effect (SZE) and found sometimes even a heating effect. Bielby and Shanks14 (2007) extended that work in 38 clusters to show that not only was the SZE less than what was expected but that it tended to progressively disappear for redshifts from 0.1 to 0.3. Their result is statistically equivalent to a null result (no shadowing) at about the 2σ level.
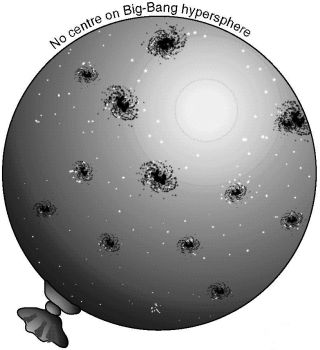
This result then brings into doubt the fact that the CMBR is from the background, i.e. from the big bang and therefore whether cosmic expansion (figure 1) is a valid hypothesis.
Update (2 March 2018)
I first made this argument in 2006 based on the work of Prof. Lieu and others. If the big bang were true, the light from the fireball should cast a shadow in the foreground of all galaxy clusters. However new research (Xiao, W., Chen, C., Zhang, B., Wu, Y., and Dai, M., Sunyaev–Zel’dovich effect or not? Detecting the main foreground effect of most galaxy clusters, MNRASL 432, L41–L45, 2013) has thrown this conclusion into doubt. Prof. Lieu at the time wrote “Either it [the microwave background] isn’t coming from behind the clusters, which means the Big Bang is blown away, or … there is something else going on.” As it turns out that “something else” is contamination of the expected shadowing by radio emissions from the galaxy clusters themselves.
Without anything to contradict this new result, and the analysis seems strong, one must entertain the possibility that the anomaly first found by Lieu et al in 2006 has been adequately explained. The problem of course is that astrophysics is not exactly operational science. At best this no-shadow argument is now equivocal and hence I suggest that it should no longer be used as an argument against the big bang hypothesis.
However, to examine that more precisely one should study the temperature of this radiation at past epochs.
In 1941, McKellar15 interpreted interstellar absorption lines in the blue part of the optical spectrum arising from diatomic CN molecules as being excited by background radiation with a blackbody spectrum and a required temperature of 2.3 K. This was from sources in the galaxy and well before the discovery of the CMBR. The big bang cosmology predicts that the temperature of CMBR is a function of redshift and that the temperature is higher than that in the galaxy by the factor (1+z).
Hence from the excitation of atomic transitions in absorbing clouds at high redshifts along the line of sight to distant quasars, assuming the atoms are in equilibrium with the CMBR, this temperature can be determined. In one such case,16 a temperature of 7.4 ± 0.8 K at z = 1.776 was derived which agrees very well with the theoretical prediction of 7.58 K. However, another component of the same cloud with a very similar redshift gave a temperature of 10.5 ± 0.5 K, not in such good agreement with theory. Others also found a similar result.17 And measurements on a cloud at z = 2.34 gave a temperature between 6 and 14 K.18 This is in accord with the 9.1 K predicted by the standard cosmology but with larger errors.
From the analysis of the C+ fine-structure population ratio in the damped Lyman alpha (Lyα) absorber system towards a quasar,19 at z = 3.025, a temperature of 14.6 ± 0.2 K was calculated, for a theoretical prediction of 10.97 K. The discrepancy is attributed to the existence of other mechanisms of excitation, like collisions, for example. But that means that other measurements (in other papers) should also be affected by other mechanisms of excitation and they can just give the maximum CMBR temperature, but not the minimum. They can’t have it both ways. We are expected to believe that when the results agree with the theoretical predictions, no other mechanisms are involved, but when the results do not agree, they are. Therefore, the increase of CMBR temperature as a function of redshift (z) by the factor (1+z) has not been proven. But the above references do generally imply that the temperature of the CMBR at higher redshifts than the present (z = 0) is higher than 2.7 K. How does a static Euclidean model explain such a general trend if it is finally proven? That is a good question.
Absorption systems and Lyα lines
When neutral hydrogen (H1) clouds are back lit by the light from a quasar, absorption lines are seen at redshifts less (shorter wavelengths) than that of the quasar (figure 2). These result from the fundamental Lyman excitation of the neutral atoms, from around 121.6 nm (for Lyman alpha, Lyα) to 102.5 nm (for Lyman beta, Lyβ). They are found in the vacuum ultra-violet part of the spectrum. The presence of a very large group of these lines (called the Lyα forest), representing many foreground hydrogen clouds, has been said to be a very good probe of the intergalactic medium.20
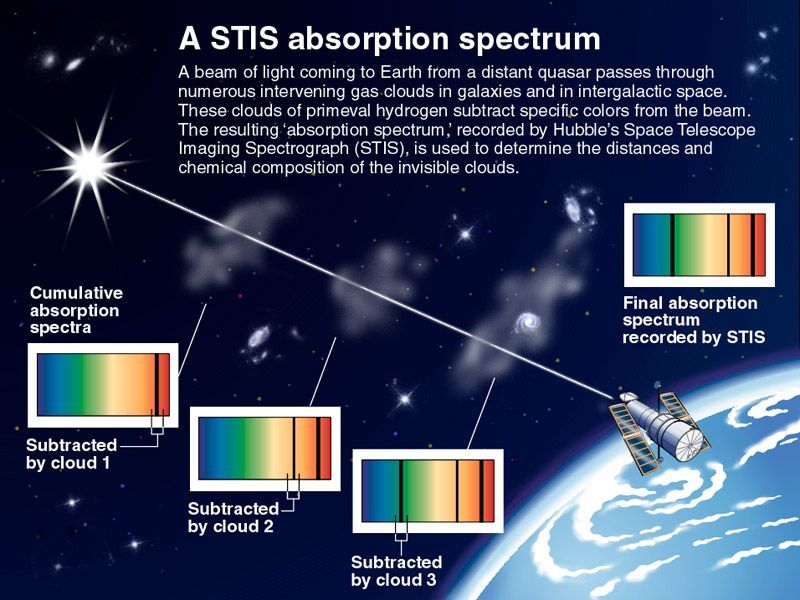
At first sight, the Lyα forest seems to be very good evidence that the quasars are at their large redshift distances. It would seem to contradict the claim of Arp and others that some quasars have large intrinsic redshifts that are not due to cosmological expansion (figure 2). The light from the quasar is uniformly redshifted. If this is due to some intrinsic effect, it would not translate into a series of lines representing lower and lower redshift distances towards the observer from absorbing hydrogen clouds in the foreground of the quasar. The absorption lines are measured at redshifts less than that of the quasar, hence would be at their cosmological redshift distances in an expanding universe.
However, all is not as it might first appear. In 2006, Prochter et al.21 published observations that they described as ‘astonishing’. They found by using spectra of GRBs they were able to “ … identify 14 strong Mg II absorbers along 14 GRB sight lines (nearly every sight line exhibits at least one absorber) … ”. This meant that every GRB they observed showed at least one absorbing cloud/galaxy in its foreground, whereas only one quarter of quasars shows the presence of absorbing clouds/galaxies.
What is so special about GRBs that they always have an absorber in their foreground? This was discussed in a letter to the journal Science,22 where it was mentioned that these features observed in the GRB spectra might be intrinsic to the ‘home galaxy’ that hosts the gamma-ray burst and not to foreground galaxies. In the case of this study, they used Mg II lines and not H1 lines.
Lanzetta of Stony Brook University in New York is quoted by the Science article,
“‘If I had to bet, I would say this is that one-in-10,000 statistical fluke that happens every now and then,’ … . ‘It will probably go away when more observations become available. We’ll have to wait and see.’ If the puzzle remains after 15 or 30 more GRBs are analyzed, however, then ‘something very strange must be going on,’ Lanzetta says.”
Well, by 2009, Tejos et al.23 found that the number of absorbing systems towards GRBs was three times larger than towards quasars (from a sample of 8 GRBs studied), and no good explanation for the anomaly is forthcoming, though a few have been proposed. This then adds doubt to the proposition that the Lyα lines represent neutral hydrogen clouds, absorbers, in the foreground of the quasars also.
A Gunn–Peterson trough is claimed to result when many Lyα absorption lines overlap due to many clouds of neutral hydrogen. This is theorized to have occurred towards the end of the so-called era of reionization. The Gunn–Peterson trough is seen in the spectra of some quasars, and is strongly dependent on redshift. It is not seen in all quasar spectra. The standard model explains this where the intergalactic medium has been reionized—hence no absorption. The Gunn–Peterson trough is evidence for the era of the dark ages (high opacity) where there is only neutral hydrogen.
López-Corredoira24 describes some observations on this:
“A hydrogen Gunn–Peterson trough was predicted to be present at a redshift z = 6.1.25,26 Indeed, a complete Gunn–Peterson trough at z = 6.28 was discovered,25 which means that the Universe is approaching the reionization epoch at zr = 6. However, galaxies have been observed at z = 6.68,27 or z = 6.56 without the opacity features28 prior to the reionization, and the epoch of reionization was moved beyond zr = 6.6.28
“An inhomogeneous reionization25 is a possibility to explain the apparent disagreement of the different data. Recent measures of CMBR anisotropies by the WMAP observations give a reionization epoch zr = 20–9+10 (95% CL).29 If we were going to believe that CMBR anisotropies are being correctly interpreted in terms of the standard cosmology, we would have again a new inconsistency.”
So the data and the theory do not really coincide. A Gunn–Peterson trough is observed at a redshift well after the epoch 11 < z < 30 from CMBR observations. So is it really due the theorized effect?
For the hydrogen cloud absorption lines to show a large redshift and the latter not to be due to cosmological expansion, then those lines would have to originate in the atmosphere of the quasar and be generated by the same unknown intrinsic effect as that of the quasar. As the light passes through a quasar’s atmosphere, the H1 atoms, as a function of distance above the quasar, would have to have different Doppler speeds inward and hence be slightly less redshifted than the putative parent quasar. In other words, it has to be some mechanism connected to the quasar itself. If not, the standard model has a good argument in favour of cosmological expansion.
Ashmore30 reviewed and analyzed the spacing of hydrogen clouds as a function of redshift, by taking literature data on numbers of neutral hydrogen clouds measured as a function of redshift from their absorption lines with background quasars. He made the usual BB assumptions that quasars are at their redshift distances and that the Lyα absorption lines result from hydrogen clouds in the foreground of quasars.
From this, Ashmore showed that the cloud spacing is constant out to a redshift of about 0.5 when most studies are combined and out to z = 1.6 from one particular survey. Beyond z ~ 0.5 generally there is a decrease in cloud spacing from other studies. With standard assumptions, this would mean the universe expanded up to z ~ 0.5 and then became static. If it once expanded, it describes an expanding universe that decelerated and became static.
Also the Doppler line broadening from the clouds indicates a near linear decrease in temperature as a function of redshift, which is the opposite of what one expects from the standard model. Above we discussed the increased redshift dependence on the temperature of the CMBR. However, if this temperature is indicative of the intergalactic medium, this implies that the CMBR must be local. For a perfect black body spectrum, if the CMBR arose from the earliest times, it must have begun at a lower temperature than observed locally.
Certainly, within the constraints of the standard cosmological model these observations are contrary to what would be expected. And if the quasars are not at their redshift distances it would change the redshift dependence of the results. But the fact alone of the quasars not being at their redshift distances would significantly change our understanding of modern cosmology.
Mainstream cosmology explains it as a coincidence and puts it down to a precarious balance between expansion and galaxy formation on the one hand and rate of ionization on the other. For lower redshifts, expansion and galaxy formation have the effect of reducing the density of H1 clouds, but the density of quasars also reduces, producing a reduction in the local background UV, which reduces the rate at which the clouds disappear by ionization under the set column density.
Conclusion
Why do quasars, supposedly the most distant sources in the universe, not show any evidence of this cosmological time dilation? The universe could simply be static—that would neatly solve the problem. Or the quasars may not be so distant—not at their redshift distances. But to save the standard model, one must assume that there has been a conspiracy of competing effects, including an accumulation of black hole mass at the core of these quasars, over cosmic time, that exactly cancels any observable time dilation.
The Hubble diagram—that tests any model with the brightness of the observed astronomical sources against their redshifts—fits a static universe with a simple Euclidean non-expanding space just as well as it does the standard concordance BB model. In the former case no dark matter, no dark energy, no inflation—all unknown in the lab— are needed. It extrapolates the simple Hubble Law to all redshifts. And it should be realized that many alternatives have been suggested for the mechanism behind the observed redshifts that don’t require cosmological expansion, however very little research has been expended on such. Nevertheless a mechanism for cosmic redshifts (the Hubble Law) has been neatly derived from Einstein’s general theory, which has been successfully tested in the solar system and with pulsar binary pairs. The latter test the theory in different domains to that of cosmological redshifts, yet they add support that the same theory would apply elsewhere.
Looking at the angular sizes of galaxies as a function of redshift, the static universe model provides a better fit than the standard model and with the least number of assumptions. However, by suitably choosing, ad hoc, evolution in size of galaxies as a function of redshift (by orders of magnitude more than any observation), the standard model can be saved. In fact, this argument is usually turned around. The big bang model is assumed to be correct, and hence galaxies must have evolved in size over cosmic time by mergers and thus it becomes only a ‘research problem’ to find how this happened.
Taking together all the evidences presented here in parts 1 and 2 (see table 1), in my opinion, it is impossible to conclude either way whether the universe is expanding or static. The evidence is equivocal.31 It would seem that cosmology is far from a precision science, and there is still a lot more work that needs to be done to resolve the apparently contradictory evidence.
Table 1. A straw poll of how the evidences stack up for an expanding universe. There is no winner due to the unknown weights to assign to the various evidences.
| EVIDENCE | PRO | CON | COMMENTS |
|---|---|---|---|
| Hubble Law | X | Derived from general relativity | |
| SNe 1a | X | Could be selection bias or intergalactic dust | |
| Dark energy | X | Required from SNe 1a but unknown | |
| Dark matter | X | Required from SNe 1a but unknown | |
| SN 1997ff time dilation | X | Evidence against no time dilation | |
| SN metallicity vs redshift | X | Contrary to expectation | |
| Quasar proper motion | X | If verified, very bad for ΛCDM model | |
| Quasar variations | X | Explained with luminosity evolution | |
| GRB luminosity variations | X | X | Explained with luminosity evolution |
| Angular size vs redshift | X | Explained with size evolution | |
| Surface brightness vs redshift | X | Explained with size evolution | |
| Galaxy size vs redshift | X | X | Unexplained by merger theory |
| Existence of CMBR | X | Predicted in 1948 but first observed in 1941 | |
| CMBR shadowing by clusters | X | Results from SZE otherwise unexplained | |
| CMBR temp. vs redshift | X | X | Inconsistent results within the same cloud |
| Quasar and Lyα absorbers | X | Doubts from MgII absorbers toward GRBs | |
| GRBs & MgII absorbers | X | ‘Astonishing’ nearly all aligned | |
| Gunn–Peterson trough | X | Doubts on redshift of ‘era of reionization’ | |
| H1 cloud spacing vs redshift | X | X | Evidence for both at some epoch |
References
- Hoyle, F., The relation of radio astronomy to cosmology, in: Bracewell, R.N. (Ed.), Paris Symposium on Radio Astronomy, IAU Symp. 9, URSI Symp. 1, Stanford University Press, Stanford, CA, p. 529, 1959. Return to text.
- López-Corredoira, M., Angular size test on the expansion of the Universe, International J. Modern Physics D 19:245–291, 2010. Return to text.
- Andrews, T.B., The Hy-Redshift Universe; in: Bunker, A.J. and van Breugel, W.J.M. (Eds.), Astr. Soc. Pacific Conference Series, vol. 193, Astron. Soc. of Pacific, San Francisco, CA, p. 407, 1999. Return to text.
- Kapahi, V.K., Observational Cosmology; in: Hewitt, A., Burbidge, G. and Fang, L.Z. (Eds.), Paris Symposium on Radio Astronomy, IAU Symp. 124, Reidel, Dordrecht, p. 251, 1987. Return to text.
- Das Gupta, P., Narlikar, J.V. and Burbidge, G.R., The counting of radio sources: is evolution necessary? Astron. J. 95:5–14, 1988. Return to text.
- Kormendy, J., Drory, N., Bender, R. and Cornell, M.E., Bulgeless giant galaxies challenge our picture of galaxy formation by hierarchical clustering, Astrophys. J. 723:54–80, 2010. Return to text.
- Stott, J.P., Collins, C.A., Burke, C., Hamilton-Morris, V. and Smith, G.P., Little change in the sizes of the most massive galaxies since z = 1, MNRAS 414:445–457, 2011. Return to text.
- Hubble, E.P. and Tolman, R.C., Two methods of investigating the nature of the nebulae red-shift, Astrophys. J. 82:302–337, 1935. Return to text.
- Lerner, E.J., Evidence for a non-expanding universe: surface brightness data from HUDF; in: Lerner, E.J. and Almeida, J.B. (Eds.), First Crisis in Cosmology Conference, AIP Conf. Proc. 822, AIP, p. 60, 2006. Return to text.
- Scarpa, R., Falomo, R. and Lerner, E.J., Do local analogs of Lyman Break Galaxies exist? Astrophys. J. 668:74–80, 2007. Return to text.
- Trujillo, I., Förster Schreiber, N.M., Rudnick, G., et al., The size evolution of Galaxies since z ~ 3: Combining SDSS, GEMS, and FIRES, Astrophys. J. 650:18–41, 2006. Return to text.
- Lerner, E.J., Tolman test from z = 0.1 to z = 5.5: preliminary results challenge the expanding universe model; in: Potter, F. (Ed.), 2nd Crisis in Cosmology Conference, Port Angeles, WA, 2008; Astr. Soc. Pacific Conf. Series, vol. 413, 3–11, 2009, arxiv.org/PS_cache/arxiv/pdf/0906/0906.4284v1.pdf. Return to text.
- Lieu, R., Mittaz, J.P.D. and Zhang, S.-N., The Sunyaev-Zel’dovich effect in a sample of 31 clusters: a comparison between the x-ray-predicted and WMAP observed cosmic microwave background temperature decrement, Astrophys. J. 648:176–199, 2006. Return to text.
- Bielby, R.M. and Shanks, T., Anomalous SZ contribution to three-year WMAP data, MNRAS 382:1196–1202, 2007. Return to text.
- McKellar, A., Molecular lines from the lowest states of diatomic molecules composed of atoms probably present in interstellar space, Publications of the Dominion Astrophysical Observatory 7(15):251–272, 1941. Return to text.
- Songaila, A., Cowie, L.L., Vogt, S. et al., Measurement of the microwave background temperature at a redshift of 1.776, Nature 371:43–45, 1994. Return to text.
- Ge, J., Bechtold, J. and Black, J. H., A New Measurement of the Cosmic Microwave Background Radiation Temperature at z = 1.97, Astrophys. J. 474:67–73, 1997. Return to text.
- Srianand, R., Petitjean, P. and Ledoux, C., The cosmic microwave background radiation temperature at a redshift of 2.34, Nature 408:931–935, 2000. Return to text.
- Molaro, P., Levshakov, S.A., Dessauges-Zavadsky, M. and D’Odorico, S., The cosmic microwave background radiation temperature at zabs = 3.025 toward QSO 0347-3819, Astron. & Astrophys. 381:L64–L67, 2002. Return to text.
- Rauch, M., The Lyman Alpha Forest in the spectra of QSOs, Annual Review of Astronomy and Astrophysics 36:267–316, 1998. Return to text.
- Prochter, G.E. et al., On the incidence of strong Mg II absorbers along gamma-ray burst sight lines, Astrophys. J. 648:L93–L96, 2006. Return to text.
- Schilling, G., Do gamma ray bursts always line up with galaxies? Science 313:749, 2006. Return to text.
- Tejos, N. et al., Casting light on the ‘anomalous’ statistics of MgII absorbers towards gamma-ray burst afterglows: the incidence of weak systems, Astrophys. J. 706:1309–1315, 2009. Return to text.
- López-Corredoira, M., Observational Cosmology: caveats and open questions in the standard model; in: Editors? Recent. Res. Devel. Astronomy & Astrophys., vol. 1, pp. 561–587, 2003. Return to text.
- Becker, R.H., Fan, X. and White, R.L., Evidence for reionization at z~6: detection of a Gunn–Peterson Trough in a z = 6.28 Quasar, Astron. J. 122:2850–2857, 2001. Return to text.
- Miralda-Escudé, J., Haehnelt, M. and Rees, M.J., Reionization of the Inhomogeneous Universe, Astrophys. J. 530:1–16, 2000. Return to text.
- Lanzetta, K.M., Chen, H.-W., Pascarelle, S., Yahata, N. and Yahil, A., The Hy-Redshift universe: galaxy formation and evolution at high redshift; in: Bunker, A.J. and van Breugel, W.J.M. (Eds.), ASP Conf. Series, vol. 193, Astron. Soc. of Pacific, S. Francisco, CA, p. 544, 1999. Return to text.
- Hu, E.M., Cowie, L.L., McMahon, R.G. et al., A redshift z = 6.56 galaxy behind the cluster Abell 370, Astrophys. J. 568:L75–L79, 2002. Return to text.
- Bennett, C.L., Halpern, M., Hinshaw, G. et al., Astrophys. J. Suppl. 148:1–27, 2003. Return to text.
- Ashmore, L., Hydrogen cloud separation as direct evidence of the dynamics of the universe; in: Potter, F. (Ed.), 2nd Crisis in Cosmology Conference, Port Angeles, WA, 2008, Astr. Soc. Pacific Conference Series, vol. 413, 3–11, 2009, vixra.org/pdf/1008.0074v1.pdf. Return to text.
- Both meanings apply: 1. Open to more than one interpretation; ambiguous; 2. Uncertain or questionable in nature. Return to text.


Readers’ comments
Comments are automatically closed 14 days after publication.