

Journal of Creation 26(1):94–100, April 2012
Browse our latest digital issue Subscribe
Genomic monkey business—estimates of nearly identical human–chimp DNA similarity re-evaluated using omitted data

A review of the common claim that the human and chimpanzee (chimp) genomes are nearly identical was found to be highly questionable solely by an analysis of the methodology and data outlined in an assortment of key research publications. Reported high DNA sequence similarity estimates are primarily based on prescreened biological samples and/or data. Data too dissimilar to be conveniently aligned was typically omitted, masked and/or not reported. Furthermore, gap data from final alignments was also often discarded, further inflating final similarity estimates. It is these highly selective data-omission processes, driven by Darwinian dogma, that produce the commonly touted 98% similarity figure for human–chimp DNA comparisons. Based on the analysis of data provided in various publications, including the often cited 2005 chimpanzee genome report, it is safe to conclude that human–chimp genome similarity is not more than ~87% identical, and possibly not higher than 81%. These revised estimates are based on relevant data omitted from the final similarity estimates typically presented.
Several recent research reports confirm the conclusions noted above. While the recent Y-chromosome comparison between human and chimp does not lend itself to a genome-wide similarity estimate, the extreme dissimilarity discovered is an insurmountable paradox for common ancestry in primate evolution because it is by far the least variable chromosome in the human genome. Finally, a very recent large-scale human–chimp genome comparison research report spectacularly confirms the data presented in this report. The human–chimp common ancestor paradigm is clearly based more on myth and propaganda than fact.
A common claim is that the DNA of chimpanzees (Pan troglodytes) and humans (Homo sapiens) are about 98% similar. This oversimplified and often-touted estimate can actually involve two completely separate concepts. 1) Gene content (the comparative counts of similar types of coding sequences present or absent between different species) and 2) similarities between the actual base pairs of DNA sequences in alignments. For the most part, the modern similarity paradigm refers to DNA sequence alignment research.
One of the major problems with overall research in the field of comparative genetics, as we will show, is that in most studies there is a great deal of preselection applied to the available biological samples and data before the final analysis is undertaken. Only the most promising data from a larger pool is typically extracted for a final analysis. Of course, you can only compare what you know is highly comparable, otherwise there is no available sequence comparison in most cases. Biological sequence data often goes through several levels of prescreening, filtering and selection before being summarized and discussed. Non-alignable regions and gaps in the sequence alignments are often omitted in the final results or their impact is obfuscated. As discussed below, this can be done in a variety of ways and must be evaluated on a case-by-case basis for each published study.
Early human–chimp studies used reassociation kinetics
The initial estimates of high human-chimp DNA similarity came from a field of study called reassociation kinetics. These initial reports fueled early claims by such popular evolutionary luminaries as Oxford Professor Richard Dawkins, who stated “Chimpanzees and we share more than 99 per cent of our genes.”1 At the time, this statement was presumptuous, because gene numbers for humans and chimps were not known. The initial drafts of the human and chimp genomes were not announced until 2001 and 2005, respectively.2–5
The supposed gene data Dawkins referred to in 1986 was an indirect estimate based on the reassociation kinetics of mixed human and chimp DNA, not clearly defined genes.1 In reassociation kinetics, heat and/or chemistry are used to separate double-stranded DNA into single strands. When the DNA is allowed to reassociate in a controlled manner, it can be fractionated using various protocols. The slower the reassociation, the more complex and gene-dense the DNA is thought to be. In general, three types of DNA can be recovered: high-copy (highly repetitive, gene poor), low-copy (moderately repetitive, low levels of genes), and single copy (gene-rich). For comparative studies, the single copy fraction of DNA is collected from two species, mixed together, disassociated and allowed to reassociate so that human and chimp DNA can recombine. The level of complementary base matching between strands can be indirectly measured by a variety of methods that indirectly measure rates/levels of reassociation.
The caveat is that only the single-copy fractions of the human and chimp genomes were utilized to obtain early estimates of similarity. Scientists focused on the single-copy fraction because of the high gene content. However, many genes are located in the other genome fractions and were thus left out of the analysis. Another problem is that virtually the entire genome is now known to be functional in some aspect and the non-coding regions have been shown to provide many critical control features and nucleotide templates.6,7,8
The first 99% similarity claim, which Cohen calls “The Myth of 1%”, was made in 1975 by Allan Wilson and Mary-Claire King using reassociation kinetics of single-copy DNA.9 Other similar studies came up with an average divergence in single-copy DNA that measured about 1.5%, producing the widely spread quotes of 98.5% DNA sequence similarity.10–12 While a vast majority of the human and chimp genomes were actually excluded in the early quest to compare DNA, the supposed high similarities in the relatively small portions represented by single copy fractions surprised researchers. The eventual consensus, as reviewed by Gibbons, was that the dramatic differences between human and chimp anatomy and behaviour were based on the assumption that small genetic differences produce enormous physical differences.13
Genomics research—affirming the myth
Subsequent research using sequenced DNA built upon the early high similarity dogma established by reassociation kinetics. In a companion to this paper, we discuss the possibility that an unspoken dogma-based ‘Gold Standard’ regarding the human–chimp similarity issue was established during the initial studies involving reassociation kinetics.14
A review paper written by creationist Todd Wood on biological similarity between human and chimp highlighted and supposedly confirmed evolutionary similarity claims, yet ignored the important bioinformatic issues surrounding widespread data omission and selective analyses.15 Wood’s review did little to support creationist claims that humans were uniquely created in the image of God rather than being a few DNA base pairs from a chimp. Therefore, our focus on DNA sequence similarity will address the same publications listed in Wood’s review in addition to several more recent papers. The summarized data from these studies including estimates of similarity adjusted for omitted data is shown in table 1.
Table 1. Summary of human–chimpanzee genome comparison papers. Where possible, omitted data from the reported alignments is used to produce an actual percent DNA identity.
Reference | Total genomic bases analyzed | Aligned bases | Reported DNA identity | Actual DNA identity* |
|---|---|---|---|---|
Britten, 2002 |
846,016 |
779,132 |
95.2% |
~ 87% |
Ebersberger et al., 2002 |
3,000,286 |
1,944,162 |
98.8% |
< 65% |
Liu et al., 2003 |
10,600,000 (total for human, chimp, baboon, and marmoset) |
4,968,069 (human–chimp) |
98.9% no indels |
? |
Wildman et al., 2003 |
~90,000 (exons from 97 genes) |
? |
98.4–99.4% |
? |
Chimp. Chrom. 22 Consort. |
32,799,845 |
? |
98.5% excluding indels |
80–85% including indels |
Nielson et al., 2005 |
? |
? |
99.4% selected gene regions |
? |
Chimp. Seq. Consort. 2005 |
Whole genome (5X redundant coverage) |
2.4 Gb |
95.8% |
81%** |
* Based on the amount of omitted DNA sequence in the alignments
** Compared to data from The International Human Genome Sequencing Consortium (2004)—((.9577 x 2.4 Gb) / 2.85 Gb) x 100
? Cannot calculate actual percent identity because data was not provided.
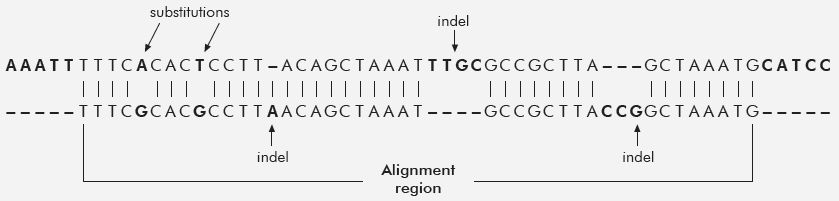
One of the first human–chimp DNA sequence papers that appeared at the beginning of the chimpanzee genome project was perhaps one of the most objective. Roy Britten, one of the early pioneers in DNA reassociation kinetics, compared the genomic sequence from five chimp large-insert DNA clones (Bacterial Artificial Chromosomes, or BACs16) to human genomic sequence using an atypical fortran-based computer program that was/is not publicly available.17 These five chimp BAC sequences were chosen because they were the only ones then available.18 Researchers typically choose initial seed BACs for genome sequencing because of their single-copy DNA content, which makes them easier to assemble and compare to other species. The total length of the DNA sequence for all 5 BACs was 846,016 bases. However, only 92% of this was alignable to human DNA, thus the final statistics reported on only 779,132 bases. To his credit, Britten included the alignment data on insertions and deletions (indels) and reported a human–chimp similarity of ~95%. However, a more realistic figure would include the complete high-quality sequence of all five BACs, which is just as legitimate as the indels within the alignments; giving a final DNA similarity of 87% (table 1). See figure 1, which graphically illustrates the concept of indels and substitutions in a pair-wise alignment between two DNA sequences.
Another notable study published by Ebersberger et al. the same year as Britten’s paper utilized chimp genome sequence obtained from randomly sheared, size-selected fragments in the 300 to 600 base range.19 These DNA sequences were aligned to an early version of the human genome assembly using the BLAT (Blast-Like Alignment Tool) algorithm. Researchers selected two-thirds of the total sequence for more detailed analyses. One-third of the chimp sequence would not align to the human genome and was discarded. The methods section in the paper19 describes how the subset of prescreened data was further filtered to obtain only the very best alignments. The resulting data was then subjected to a variety of comparative analyses that, for all practical purposes, are completely meaningless given the extremely high level of selection, data masking, and filtering applied. Not surprisingly, they report only a 1.24% difference in only highly similar aligned areas between human and chimp. A more realistic sequence similarity based on the researchers’ own numbers for discarded data in the alignments alone is not more than 65% (table 1).
Shortly after these initial human–chimp comparison papers, a disturbing trend quickly emerged. This trend involved only reporting final alignment results and omitting the specific details of how such data was filtered, masked and selected. Key data to allow critical readers of human–chimp similarity papers to calculate a more accurate overall similarity began to be consistently omitted. For example, Liu et al. reported on the alignment of human genomic sequence with chimp, baboon, and marmoset.20 Important information concerning the starting set of sequences and specific data for the alignments was omitted. They state only that they used a total amount of 10.6 Mb of sequence for all species combined. Their similarity estimate on the final alignment, omitting indels and non-aligned areas, was 98.9%. Including indels, we derived a value of 95.6% for the alignments, similar to Britten’s research. Important data outside the aligned areas was impossible to evaluate because of the omitted sequence data.
Another disturbing trend is that only highly conserved protein-coding sequence (exons) are often utilized to report genome-wide similarity. We now know that non protein-coding sequences, which comprise greater than 95% of the genome, are critical to all aspects of genetics and genome function.8 Typical of the trend to only align exonic sequences, Wildman, et al. reported on a study that compared only human and chimp protein coding regions of 97 exon fragments for a total of 90,000 bases.21 The preselected exons were based on the fact that they were present in both humans and chimps and already known to be highly alignable. Because of these bias issues and a lack of detail in the materials and methods, it is impossible to arrive at a valid estimate of omitted data and actual similarity in this case (table 1).
In 2004, Watanabe et al. used a variety of BAC libraries to select clones for DNA sequencing representing chimp chromosome 22.22 The sequence was then compared to its similar human homolog. The caveat is that the individual chimp BAC clones were only selected if they each contained 6 to 10 human DNA markers. Once again, we have an initial level of biased pre-selection occurring. In this case, it is happening before the DNA sequence data is even generated. Unfortunately, critical overall DNA alignment statistics are not given in the paper or in the supplemental information. The authors state a nucleotide substitution rate of 1.44% in aligned areas, but do not give similarity estimates to include indels. While indels are omitted from the alignment similarity, the authors indicate that there were 82,000 of them and provide a histogram that graphically shows the size distribution based on binned data groupings. Oddly, no data for average indel size or total indel length was provided. Likewise, the number of sequence gaps were given, but nothing about cummulative gap size. Despite the fact that supposedly well-sequenced orthologous chromosomal regions are being compared, specific data that would allow one to calculate overall DNA similarities are conspicuously absent. Based on an estimate using the limited graphical data provided regarding base substitutions and indels, a rough and fairly conservative estimate of about 80 to 85% overall similarity can be inferred (table 1).
One of the most ambiguous of all human–chimp studies was published by Nielson et al.23 In keeping with the established obfuscational trend, only highly conserved exons were used and no data were given to allow one to calculate any type of real overall similarity. Of the total starting number of gene sequences in the analysis (20,361) the researchers decided to throw out 33% (6,630) in an ambiguously stated “very conservative quality control”. In other words, one third of the initial chimp data did not align to human, so it got tossed out. In fact, no hard data was actually given to even assess the final two-thirds of chimp data that was compared. The authors only report on sequence substitution divergence beyond ‘silent sites’. These ‘silent sites’ are the areas where the data was thrown out; representing locations where genetic variation supposedly exhibits little to no effect on genome function. This is an errant presupposition that is coming under scrutiny due to the fact that the majority of the non-coding portions of the genome are now proven to be functionally active. Data for important indel differences was also completely omitted. Unfortunately, there was not enough data provided in this highly obfuscated report to obtain even a rough calculation of similarity.
Chimpanzee rough draft genome assembly data—81% similarity?
The major milestone publication regarding human–chimp genome comparisons was the 2005 Nature paper from the International Chimpanzee Genome Sequencing Consortium.4 Unfortunately, this paper followed the previously established trend where most of the comparative data was given in a highly selective and obfuscated format and detailed information about the alignments was absent. The majority of the paper was primarily concerned with a variety of hypothetical evolutionary analyses for various divergence rates and selective forces. Hence, the critical issue of overall similarity was carefully avoided.
However, based on the numbers given in the chimp genome paper, one can determine a rough overall genome similarity between humans and chimp by including published concurrent information from the human genome project. In regards to the overall alignment, the authors state, “Best reciprocal nucleotide-level alignments of the chimpanzee and human genomes cover ~2.4 gigabases (Gb) of high-quality sequence”.24 At this time, the human euchromatic assembly was estimated to be 99% complete at 2.85 Gb and had an error rate of 1 in 100,000 bases.25 The chimp genome authors state, “The indel differences between the genomes thus total ~90 Mb. This difference corresponds to ~3% of both genomes and dwarfs the 1.23% difference resulting from nucleotide substitutions.”26
In summary, only 2.3 Gb of chimp sequence aligned onto the highly accurate and complete human genome (2.85 Gb) an operation that included the masking of low complexity sequences. For the chimp sequence that aligned, the data for substitutions and indels indicates 95.8% similarity, a biased figure which excludes the masked regions. Using these numbers, an overall estimate of chimp compared to human DNA produces a conservative estimate of genome-wide similarity at 80.6%. In 2005, a five-fold redundant coverage of the chimp genome had been attained, which should have represented greater than 95% of the overall sequence.
Wood’s report features an analysis that attempts to validate the entire 2005 chimp genome assembly.27 Wood’s comparison between human and chimp used deduced amino-acid sequences from gene orthologs already known to be similar, thus alignable. Protein amino acid comparisons between electronically translated coding sequences of known orthologs is hardly an accurate indicator of genome-wide DNA sequence similarity. Orthologs are genes in different species that are assumed to have evolved from a common ancestral gene primarily because they have the same function and similar sequence in both species. Amino acid comparisons between electronically translated coding sequence of known orthologs is also not an accurate indicator of genome-wide sequence similarity because less than 5% of the human genome actually contains protein-coding sequence. Yet another problem with using electronically generated proteins for comparisons is highlighted by the fact that a majority of mammalian genes undergo alternative transcription and translational start/stop sites, multiple mechanisms of exon splicing, intragene regulatory RNA coding segments, enhancer elements and many other complex transcriptional splicing code features.28,29 In light of our current knowledge of how the genome actually functions, the antiquated approach of using electronically deduced nuclear protein sequences for intergenome comparisons needs to be seriously reconsidered by both evolutionists and creationists.
The human–chimp paradigm starts to crumble
Following Wood’s summary15 of some of the major papers involved in the human–chimp similarity myth, several key reports emerged that called into question the dogma of the human-primate evolutionary paradigm. The first was a study by Ebersberger et al., in which a large pool of human, chimp, orangutan, rhesus and gorilla genomic sequences was used in constructing phylogenies (multiple alignments analyzed in evolutionary tree format).30 The original pool of DNA sequences actually went through several levels of selection to preanalyze, trim and filter them for optimal alignment. First, a set of 30,112 sequences were selected that shared homology (overlapping similarity) between the five species. These sequences were aligned and only those which produced ≥ 300 base alignments were retained for another series of alignments and only the sequences that produced superior statistical probabilities > 95% were used in the final analysis. This filtering process removed over 22% of already-known, pre-selected homologous sequence. Despite all of this data filtering designed to produce the most favourable evolutionary alignment and trees, the results did not show any clear path of ancestry for humans with chimps or any of the great apes. What emerged was a true mosaic of unique human and primate DNA sequences; discounting any clear path of common ancestry. Perhaps the best summary of the research can be found in the author’s own words.
“For about 23% of our genome, we share no immediate genetic ancestry with our closest living relative, the chimpanzee.
“Thus, in two-thirds of the cases a genealogy results in which humans and chimpanzees are not each other’s closest genetic relatives. The corresponding genealogies are incongruent with the species tree. In accordance with the experimental evidences, this implies that there is no such thing as a unique evolutionary history of the human genome. Rather, it resembles a patchwork of individual regions following their own genealogy.”31
The authors add that the lack of support for a consistent and clear evolutionary tree among humans and other primates is due to the “inclusion of alignments with no clear phylogenetic signal,”32 a significant statement given the fact that they used extremely high levels of data filtering and selection designed to provide enormous levels of “phylogenetic signals”.
The Y-chromosome bombshell
One of the most dogma-damaging reports to surface in recent years is the Y-chromosome comparison between humans and chimps.33 In this study, the male-specific region (MSY), a large region of the Y-chromosome, was compared between human and chimp. To accomplish this, a fair amount of resequencing had to be performed due to the fact that the chimp sequence in this area was fragmented and incomplete. The end result was 25,800,000 bases of highly accurate chimp Y-chromosome sequence distributed among eight contiguous segments. When compared to the human Y-chromosome, the differences were enormous. The authors state, “About half of the chimpanzee ampliconic sequence has no homologous, alignable counterpart in the human MSY, and vice versa.”34 The ampliconic sequence contains ornate repeat units (called palindromes) that read the same forwards as they do backwards. Dispersed within these palindromes are families of genes that are expressed primarily in the male testes. Not only did 50% of this type of sequence fail to align between human and chimp in the Y-chromosome, humans had over twice as many total genes (60 in humans vs 25 in chimp). There were also three complete categories of genes (gene families) found in humans that were not even present in chimps. Related to this large difference in gene content, the authors note, “Despite the elaborate structure of the chimpanzee MSY, its gene repertoire is considerably smaller and simpler than that of the human MSY,”35 and “the chimpanzee MSY contains only two-thirds as many distinct genes or gene families as the human MSY, and only half as many protein-coding transcription units.”35
Besides these distinctively male-type genes, there were other areas characterized that contained genes labelled as ‘X-degenerate’, a somewhat misleading term based on the assumption that the X-degenerate genes have homologs on the female X chromosome from which they are postulated by evolutionists to have evolved. A comparison of X-degenerate gene regions between humans and chimps also showed distinct organizational and locational differences in addition to differences in gene content. In fact, humans have three types (classes) of X-degenerate genes that are not even present in chimps.
Besides the large differences in gene content between human and chimp MSY regions, the overall structural differences were enormous. Take note of some of the additional comments from the authors:
“Moreover, the MSY sequences retained in both lineages have been extraordinarily subject to rearrangement: whole chromosome dot-plot comparison of chimpanzee and human MSYs shows marked differences in gross structure.
“The chimpanzee ampliconic regions are particularly massive (44% larger than in human) and architecturally ornate, with 19 palindromes (compared to eight in human) and elaborate mirroring of nucleotide sequences between the short and long arms of the chromosome, a feature not found in the human MSY.
“Of the 19 chimpanzee palindromes, only 7 are also found in the human MSY; the other 12 are chimpanzee-specific. Unlike the human MSY, nearly all of the chimpanzee MSY palindromes exist in multiple copies.”34
The large differences in both structural arrangements of unique DNA features and gene content described in the Y-chromosome study, is particularly damaging to human-chimp DNA similarity mythos and the dogma of primate evolution. In fact, the authors shockingly note that given “… 6 million years of separation, the difference in MSY gene content in chimpanzee and human is more comparable to the difference in autosomal gene content in chicken and human, at 310 million years of separation.”35
The main problem with these drastic differences between human and chimp Y-chromosomes is that the evolutionary dogma cannot account for it. A large study of genetic variation in the human genome showed that the Y-chromosome was exceptionally stable and had five times less genetic variation than the autosomes.36 This data makes perfect sense because the Y-chromosome has no similar homolog in the genome and undergoes very little recombination with the X-chromosome during meiosis. Given this lack of recombination and sequence diversity on the Y-chromosome, the primate evolution model encounters a serious problem, because the human and chimp Y-chromosomes should be considerably more similar to each other. Evolutionists consider high levels of DNA sequence variation as positive indicators of places in the genome that evolve rapidly. Therefore, the Y-chromosome should have signatures of such activity because it is so markedly different from chimp, but it has not. Instead, it appears to be very static and stable, with very few structural differences and little sequence diversity among human males worldwide. The proven stability of the Y-chromosome compared to the rest of the human genome, combined with the large differences between human and chimp, is an insurmountable enigma for the human–chimp common ancestry paradigm.
Some cases of high similarity may be due to contamination
Another factor to consider in the human-chimp similarity debate is that some cases of high sequence similarity may be due to contamination. Not only is the chimpanzee genome assembly still largely based on the human genomic framework, it also now appears that the wide-spread contamination of non-primate databases with human DNA is a serious problem and can run as high as 10% in some cases.37 Human contamination results from the process of cloning DNA fragments in the lab for sequencing where airborne human cells come from coughing, sneezing, and physical contact with contaminated fingers. The detection and characterization of human DNA contamination in primate databases could be a difficult and highly subjective endeavour because of the overriding dogma of primate evolution. It is also noteworthy that the chimpanzee genome was sequenced during the time period where wide-spread human DNA contamination was not well exposed. The contamination problem is also confounded by the use of the human framework for chimp sequence assembly and annotation.
In fact, contamination is not only possible via laboratory error, but is introduced on purpose during chimpanzee genome assembly and annotation based on Darwinian dogma. On a recent website at the Ensembl database (joint bioinformatics project between EMBL-EBI and the Wellcome Trust Sanger Institute), a webpage titled ‘Chimp Genebuild’ provides the following information as to one of the ways in which the human genome is used as a guide to assemble and annotate the chimp genome:
“Owing to the small number of proteins (many of which aligned in the same location) an additional layer of gene structures was added by projection of human genes. The high-quality annotation of the human genome and the high degree of similarity between the human and chimpanzee genomes enables us to identify genes in chimpanzee by transfer of human genes to the corresponding location in chimp.
“The protein-coding transcripts of the human gene structures are projected through the WGA [whole genome assembly] onto the chromosomes in the chimp genome. Small insertions/deletions that disrupt the reading-frame of the resultant transcripts are corrected for by inserting ‘frame-shift’ introns into the structure.”38
Not only is the chimpanzee genome assembled using the human genome as framework, human sequence contamination is admitted to exist because it was electronically added to fill in putative missing chimp sequences. Based on the myth and dogma that human DNA is supposedly nearly identical to chimp, bits and pieces of human DNA have been fitted into gaps and regions of the chimp genome, making it appear more human. As a result, when downloading the assembled and annotated chimp genome sequence for independent study, the researcher does not have 100% unbiased chimp sequence, as often assumed. Instead, there is a patchwork of human and chimp sequence pieced together, aligned, and oriented based on the human genome.
Conclusion—human and chimp DNA not so similar after all
The chimpanzee genome in its final annotated and assembled state is clearly a biased product. In addition, nearly all research reports on human–chimp DNA similarity omit significant amounts of data that do not align or represent gaps in the sequence. In fact, a significant number of papers do not even include enough data to allow an independent reader the ability to factor in how much original dissimilarity existed before the final, highly filtered numbers are given. In regards to an estimate of human–chimp genome similarity from data provided (but often buried) in published reports, it is safe to say that it is not more than 81 to 87% and quite possibly lower.
In support of this conclusion, a large-scale human–chimp genome comparison research project was just recently published in a separate journal.39 This study completely substantiates and confirms the data presented in this report. In this study, author Tomkins reports on the pair-wise alignment data of 40,000 random chimpanzee genomic sequences compared to four different versions of the human genome using the blastn algorithm run under 30 different parameter combinations. This effort produced a total of 1.2 million attempted alignments—4.8 million if you factor in the four different human genome assemblies. Excluding data for the large amount of chimp sequence that did not align, Tomkins reported a very conservative estimate of human–chimp DNA similarity in just the aligned regions at 86–89% (depending on algorithm parameters). Results from this extensive and very objective study unequivocally indicate that the human and chimpanzee genomes are at least 10–12% less identical than is commonly claimed. The human-chimp common ancestor paradigm, which claims a nearly identical DNA content, is clearly based more on myth and propaganda than real factual data.
References
- Dawkins, R., The Blind Watchmaker: Why the Evidence of Evolution Reveals a Universe Without Design, W.W. Norton, New York, p. 263, 1986. Return to text.
- International Human Genome Sequencing Consortium, Initial sequencing and analysis of the human genome, Nature 409:861–920, 2001. Return to text.
- Venter, J.C. et al., The sequence of the human genome, Science 291:1304–1351, 2001. Return to text.
- The Chimpanzee Sequencing and Analysis Consortium, Initial sequence of the chimpanzee genome and comparison with the human genome, Nature 437:69–87, 2005. Return to text.
- For a recent review on genome sequencing that explains the various technologies used in sequencing human and chimp see: Tomkins, J., How Genomes are sequenced and why it matters: implications for studies in comparative genomics of humans and chimpanzees, Answers Research J. 4:81–88, 2011, www.answersingenesis.org/articles/arj/v4/n1/implications-for-comparative-genomics. Return to text.
- Bergman, J., The functions of introns: from junk DNA to designed DNA, Perspectives on Science and Christian Faith 53(3):170–178, 2001. Return to text.
- Woodmorappe, J., Junk DNA indicted, J. Creation (formerly Creation Ex Nihilo Tech. J.) 18(1):24–33, 2004. Return to text.
- Wells, J., The Myth of Junk DNA, Discovery Institute Press, Seattle, WA, 2011. Return to text.
- Cohen, J., Relative differences: the myth of 1%, Science 316:1836, 2007. Return to text.
- Hoyer B.H. et al., Examination of hominid evolution by DNA sequence homology, J. Human Evol. 1:645–649, 1972. Return to text.
- Sibley, C.G. and Ahlquist, J.E., The phylogeny of the hominoid primates, as indicated by DNA-DNA hybridization, J. Mol. Evol. 20:2–15, 1984. Return to text.
- Sibley, C.G., DNA hybridization evidence of hominoid phylogeny: a reanalysis of the data, J. Molec. Evol. 30:202–236, 1990. Return to text.
- Gibbons, A., Which of our genes make us human? Science 281:1432–1434, 1998. Return to text.
- See Bergman, J. and Tomkins, J., Is the human genome nearly identical to chimpanzee?—a reassessment of the literature, J. Creation 26(1):54–60, 2012. Return to text.
- Wood, T.C., The chimpanzee genome and the problem of biological similarity, Occasional Papers of the BSG 7:1–18, 2006. Return to text.
- For information explaining BACs, See Tomkins, ref. 5, p.1. Return to text.
- Britten, R.J., Divergence between samples of chimpanzee and human DNA sequences is 5% counting indels, Proc. Nat. Acad. Sci. 99:13633–13635, 2002. Return to text.
- Britten, personal communication, 15 July 2011. Return to text.
- Ebersberger, I. et al., Genomewide comparison of DNA sequences between humans and chimpanzees, American J. Human Genetics 70:1490–1497, 2002. Return to text.
- Liu, G. et al., Analysis of primate genomic variation reveals a repeat-driven expansion of the human genome, Genome Res. 13:358–368, 2003. Return to text.
- Wildman, D.E. et al., Implications of natural selection in shaping 99.4% nonsynonymous DNA identity between humans and chimpanzees: enlarging genus Homo, Proc. Nat. Acad. Sci. 100:7181–7188, 2003. Return to text.
- Watanabe, A.F. et al., DNA sequence and comparative analysis of chimpanzee chromosome 22, Nature 429:382–388, 2004. Return to text.
- Nielson R. et al., A scan for positively selected genes in the genomes of humans and chimpanzees, PLOS Biology 3(6):e170. doi:10.1371/journal. pbio.0030170, 2005. Return to text.
- Ref. 4, p. 71. Return to text.
- International Human Genome Sequencing Consortium, Finishing the euchromatic sequence of the human genome, Nature 431:931–945, 2004. Return to text.
- Ref. 4, p. 73. Return to text.
- Wood, ref. 15, p. 3. Return to text.
- The ENCODE Project Consortium, Identification and analysis of functional elements in 1% of the human genome by the ENCODE pilot project, Nature 447:799–816, 2007. Return to text.
- Barash Y. et al., Deciphering the splicing code, Nature 465:53–59, 2010. Return to text.
- Ebersberger, I. et al., Mapping human genetic ancestry, Molec. Biol. Evol. 24:2266–2276, 2007. Return to text.
- Ebersberger et al., ref. 30, p. 2266. Return to text.
- Ebersberger et al., ref. 30, p. 2269. Return to text.
- Hughes, J.F. et al., Chimpanzee and human Y chromosomes are remarkably divergent in structure and gene content, Nature 463:536–539, 2010. Return to text.
- Hughes, J.F. et al., ref. 33, p. 537. Return to text.
- Hughes, J.F. et al., ref. 33, p. 538. Return to text.
- International SNP Map Working Group, A map of human genome sequence variation containing 1.42 million single nucleotide polymorphisms, Nature 409:928–933, 2001. Return to text.
- Longo, M.S. et al., Abundant human DNA contamination identified in non-primate genome databases, PLoS ONE 6(2):e16410, 2011. Return to text.
- As of Jan 13, 2012, see ensembl.fugusg.org/Pan_troglodytes/chimp_build. html. If this URL and/or page is no longer active, author Tomkins can be contacted for an archive PDF of the cited web page (jtomkins@icr.org). As stated, the Ensembl code is available for public download and use. Return to text.
- Tomkins, J.P., Genome-wide DNA alignment similarity (identity) for 40,000 chimpanzee DNA sequences queried against the human genome is 86–89%, Answers Res. J. 4:233–241. Return to text.


Readers’ comments
Comments are automatically closed 14 days after publication.