
Response to Geochronology: Understanding the Uncertainties, a presentation by Dr Justin Payne
In an address in Adelaide, Australia, Dr Justin Payne, a lecturer within the School of Earth and Environmental Sciences at the University of Adelaide, set out to ‘disprove’ objections to long-age radiometric dating including material from CMI. His talk was to Reasonable Faith Adelaide, a group that describes themselves as fundamentally a Christian association and that invites and welcomes non-Christians, skeptics, and atheists to their gatherings. At the request of one of those who attended Dr Payne’s address, physicist Dr Jim Mason, from Canada, reviewed the video plus all the material from the meeting and prepared the following detailed response.
On June 6, 2014, Dr Justin Payne gave a presentation entitled Geochronology: Understanding the Uncertainties, to a group in Adelaide, Australia, called Reasonable Faith Adelaide in which talk Dr Payne discussed the lead-lead technique for radiometric dating ‘hard’ rocks and how this relates to the age of the earth. This is a response to Dr Payne’s presentation.
In preparing this response, I have read the summary of the talk provided on the website of Reasonable Faith Adelaide1, reviewed Dr Payne’s slides2 and watched a recording of his actual presentation.3
This is a somewhat arcane topic, albeit one with some considerable significance with respect to the age of the earth. Although Dr Payne asked during his talk how many people had a scientific or engineering background, I was unable, from the recording, to see the scope of the response but inferred that it was not universal. Consequently, I have adopted an approach in this response that assumes that not everyone will have that background. At the risk of making the response perhaps a bit longer than it might otherwise need to be and, perhaps, a bit more pedantic in places that it might otherwise need to be, this seemed like the most appropriate approach. There is no intent with this approach to insult anyone’s knowledge or intelligence but simply to be thorough and comprehensive.
General considerations
Before getting mired in details, it seems appropriate to review some more general considerations that impact this issue. While it is possible that these aspects have been discussed within the Adelaide group in the past, it seems safer to proceed as it they had not, in order to provide a self-contained discussion.
First there is the differentiation of operational science and historical science4—or, equivalently, the differentiation between the collection of data using the scientific method (using repeatable experimentation) and the interpretation of these data to infer some behaviour/event in the past.
This is well illustrated by Dr Payne’s talk. Measurements are made in the present using a well-defined, detailed process for preparing the zircon crystal and sophisticated equipment for measuring the amounts of different isotopes of different elements present today in the sample. These measurements are then analyzed using various formulas and techniques to infer something about the past history of the crystal. This analysis depends on certain assumptions. Dr Payne discusses the assumptions aspect at some length in his talk and, in fact, this seems to be the central element of the talk. (More about this later.)
What is often overlooked is that, underlying the assumptions, there are presuppositions that can have a profound impact on the assumptions and, therefore, the analyses and conclusions, even to the extent of precluding getting the correct answer. Dr Payne alludes to this near the end of his talk when he says something to effect of “people who believe in Flood Geology are forced …” implying that the acceptance of Flood Geology as a presupposition would have an impact on—indeed ‘force’—a particular interpretation of the data.
The fundamental presupposition of most scientists these days is that of naturalism, the view that nature is all that there is. Sometimes this is referred to as materialism, the view that matter is all that there is. By definition, these exclude the potential existence of, respectively, the supernatural and the immaterial. A consequence of this is that it forces an explanation of everything, including the origin of things, using only matter and observed natural processes—in other words, the laws of physics and chemistry.
Naturalism/materialism is often coupled with the assumption of uniformitarianism, that is that natural processes have always gone on at the same rate as we see them happening today. This is, in fact, one of the three assumptions Dr Payne discusses with respect to radiometric dating and the only one of the three that he regards as being applicable.
The presupposition of naturalism and the assumption of uniformitarianism have been commonly combined and applied in the area of geology since the time of James Hutton. In 1795 Hutton wrote a book in which he said, “The past history of our globe must be explained by what can be seen to be happening now. … No powers are to be employed that are not natural to the globe, no action to be admitted except those of which we know the principle”.5 This idea was subsequently taken up and expanded upon by Charles Lyell who, in 1833, wrote a two-volume Principles of Geology that was subtitled “an attempt to explain the former changes of the earth’s surface, by reference to causes now in operation”.
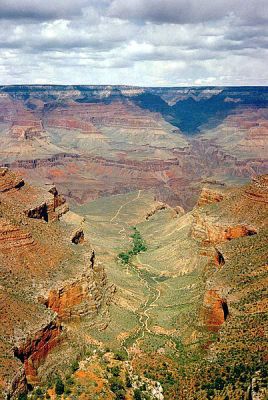
Note that in neither case were these positions derived from the data. Rather they were philosophical perspectives imposed on the interpretation of the data. One of the results of imposing this interpretative framework is that the evidence of many thick layers of rock and abundant erosion, that are so obvious in places like the Grand Canyon, have been interpreted as requiring millions of years to deposit and erode.
However, this naturalistic uniformitarian interpretative framework is not required in order to adequately understand the evidence.
Nicolas Steno, who lived about 100 years before Hutton, is considered by many to be one of the fathers of modern geology because of four geological principles he formulated. One of these, known as the Law of Superposition, relating to sedimentary rock layers, states that lower layers are older than higher layers because the lower ones needed to be present before the higher ones could be deposited on top of them. The website of the University of California, Berkeley, says this about this law: “It should also be remembered that Steno’s law is a statement of relative time, not absolute time: two rock layers, in principle, could have formed millions of years apart or a few hours or days apart. Steno himself saw no difficulty in attributing the formation of most rocks to the flood mentioned in the Bible.”6
(Although not directly relevant to the topic of discussion, it is interesting to note that the website goes on the say “However, he [Steno] noticed that, of the two major rock types in the Apennine Mountains near Florence, the lower layers had no fossils, while the upper ones were rich in fossils. He suggested that the upper layers had formed in the Flood, after the creation of life, while the lower ones had formed before life had existed.”)6
So it is clear that the geological data themselves do not require a long-age interpretation but rather the long-age interpretation is a result of the underlying presuppositions imposed on the interpretation of the data.
Now there is inherently nothing wrong with interpreting data based on presuppositions. This goes on in our courts all the time. In criminal trials there is one set of data—the evidence—but two interpretations based on two different presuppositions. One interpretation is based on the presupposition that the defendant is guilty, the other interpretation is based on the presupposition that the defendant is innocent. The job of the jury is to examine the evidence, listen to the two interpretations, decide which interpretation provides the best explanation of the evidence and, therefore, which underlying presupposition in most likely correct.
It should be noted, however, that the nature of the presupposition(s) may preclude getting to the right answer. This can be demonstrated with a couple of simple examples.
Here in Canada we might wake up some morning to observe a metre of snow on the ground and that, currently, the snow is falling at a rate of 1 mm/hr. Applying the uniformitarian principle that the amount of snow on the ground ‘must be explained by what can be seen to be happening now’, would result in an answer of 1000 hours being the time required for the observed snow to have accumulated. However, we also know, from direct observation, that there was no snow on the ground when we went to bed the previous night. So clearly the answer derived from a uniformitarian presupposition is wrong. But we would not know this if we hadn’t actually seen the state of things the previous evening (i.e. in the past).
Now consider the 747. We know how it flies (Newton’s laws of motion)—that’s operational science—but this tells us nothing about its origins. If we are required to explain the origin of the 747, i.e. how it came into existence, using only natural processes, we might come up with some story involving junk yards and tornados. However, we know that whatever the story, it would be incorrect because the origin of the 747 involved a lot of directed intellectual effort and purposeful physical effort on the part of a great number of intelligent beings. These efforts do not qualify as natural processes. However, if we enlarge our presupposition to allow for the possible existence and involvement of intelligent beings causing unnatural processes to occur, then we can explain—correctly—how the 747 came into existence. So, in this case, restricting the solution space to that involving only natural processes precludes one from getting the correct answer. We know this because, in this case, we know the correct answer. In other cases where we don’t know the correct answer, it may be just as true that limiting our solution space to that allowed by only natural processes may preclude getting the correct answer.
Note that allowing the solution space to include, in addition to natural processes, the possible existence and involvement of intelligent beings that might cause what would be considered to be unnatural processes, does not preclude us from determining how the 747 flies—i.e. does not impact the conduct of good operational science. In fact, the scientist who worked out the laws of physics that govern how the 747 flies, Sir Isaac Newton, was a firm believer in the God of the Bible.
So in summary:
- it is important to differentiate data collected by the scientific method from an interpretation of these data
- it is important to understand the assumptions that are used in the interpretation of data
- it is important to understand the presuppositions that underlie assumptions and interpretation
- applying a uniformitarian assumption can easily result in a wrong answer
- the presupposition of naturalism/materialism is restrictive and can easily preclude getting the correct answer
Dr Richard Lewontin, an evolutionary biologist at Harvard, has summarized this situation very well.
“Our willingness to accept scientific claims that are against common sense is the key to an understanding of the real struggle between science and the supernatural. We take the side of science in spite of the patent absurdity of some of its constructs, in spite of its failure to fulfill many of its extravagant promises of health and life, in spite of the tolerance of the scientific community for unsubstantiated just-so stories, because we have a prior commitment, a commitment to materialism. It is not that the methods and institutions of science somehow compel us to accept a material explanation of the phenomenal world, but, on the contrary, that we are forced by our a priori adherence to material causes to create an apparatus of investigation and a set of concepts that produce material explanations, no matter how counter-intuitive, no matter how mystifying to the uninitiated. Moreover, that materialism is an absolute, for we cannot allow a Divine Foot in the door.”7
Detailed considerations
Now let’s turn to the specifics of Dr Payne’s presentation.
In the following, I will refer to the different isotopes and elements involved in the radioactive decay process as follows:
- The radioactive substance that is the start of the process, I will refer to as either the radioactive element/isotope or the ‘parent’
- The stable substance that is the end of the decay chain, I will refer to as either the radiogenic, stable end-product isotope or the ‘daughter’
I may also use ‘decay rate’ and ‘half-life’ interchangeably. These are, in fact, related by
e-λt = e-ln(2)t/T1/2
where λ is the decay rate
T1/2 is the half-life
ln(2) in the natural logarithm of 2 (≃0.693)
and t is the time after time 0 (e.g. after rock formation)
Uncertainty
Fairly early in his talk, Dr Payne introduces the concept of ‘uncertainty’ using the example of an ‘age’ of 500 Ma ± 2 Ma, making the observation that the relative size of 2 to 500 means that there is very little uncertainty in the ‘age’. With this example he is intending to imply (I think) that, while 500 might not be the correct age, the correct age would lie somewhere in the range of 498–502 Ma.
However, this is actually experimental uncertainty, often referred to as experimental error. What it conveys is that if the same experiment is performed repeatedly using all the same methods, process, techniques and equipment, then the result could be expected to ‘usually’ fall within the range indicated. The range could correspond to the probable error (in which case ‘usually’ = 50% of the time), the standard deviation of the data (in which case ‘usually’ = about 68% of the time), the 3-sigma range (in which case ‘usually’ = about 99.7% of the time), the 5-sigma range (in which case ‘usually’ = about 99.9999% of the time) or other. This sort of uncertainty is akin to a measure of the repeatability, or precision, in the result.
However, the experimental uncertainty says nothing about the accuracy of the result, that is, the difference between the measured/calculated result and the true value.

The difference between precision and accuracy is well illustrated by the micrometer which was designed to measure the dimensions of machined parts with both high accuracy and precision. (see Figure 1.) The accuracy derives from the relationship between the spindle and the anvil while the precision derives from the special scale on the barrel. If a piece of the spindle is missing, the precision will not be affected but the accuracy will. Another example would be a simple tape measure. If the first metre of the tape measure were missing, it would still be possible to measure lengths to the nearest millimetre (the precision or experimental error) but the measurements would all be inaccurate. Also for the tape measure, manufacturing variations might cause the spacing of the millimetric markings to be incorrect, or even to vary throughout the length of the tape, resulting in the same outcome.
The only way to ensure measurements are both accurate and precise is to calibrate the ‘tool’ against a known quantity. Government inspectors do this frequently with petrol pumps to ensure customers are getting the indicated quantity of petrol. When it isn’t possible to do an independent calibration, it may be acceptable to measure the same thing with several different tools (which may have different degrees of inherent precision). If the results agree within the ‘experimental uncertainty’ (precision) associated with the tools, then it would be reasonable (but not necessarily correct) to conclude that the results are close to the correct value. Thus, if one were to weigh a marlin using a spring scale and a piezoelectric scale and get the same answer, since two different types of instruments were used, one could reasonably conclude that the result was the actual weight. Using either one on its own could not be guaranteed to give the correct weight unless it had very recently been calibrated using a known weight that was near the weight of the marlin.
The impact of the assumptions and presuppositions on the value of the result must also be taken into account. That is, while two different approaches may have yielded the same result, if the two approaches fundamentally make the same assumption, they may not be sufficiently independent to support the calculation of an accurate answer. For example, it the marlin is weighed using two different piezoelectric scales from the same manufacturer, these may have been designed/manufactured with the same defect and therefore may not be giving the correct result even though the two weights agree.
Assumptions: Initial composition and closed system
Dr Payne lists three assumptions often associated with radiometric dating taken from a book published in 1931 and then proceeds to argue that two of these—viz. no stable end-product isotope (daughter) present at the time of rock formation and a closed system since formation—are no longer applicable.
He then goes though a description of the particular dating method he uses to estimate the age of zircon crystals. Setting aside for a moment whether the above two assumptions are or are not applicable to this technique, they are certainly applicable to other techniques that are commonly used. These are techniques that do not have two radioactive isotopes of the same element that transform into two stable isotopes of the same end-product. (In the case described by Dr Payne, these are uranium and lead respectively.)
One of these other techniques is the Potassium-Argon (K-Ar) technique which uses the transformation of radioactive potassium (40K) into stable argon (40Ar) by either beta (β+) decay or electron capture. This technique is commonly used to date volcanic eruptions, particularly tuffs (volcanic ash) that are found between layers of sedimentary rock. This was actually referred to by Dr Payne in his illustration at the end of the talk about the age of Mount Ararat and accelerated nuclear decay. (More about this later.).
Because argon is a noble gas and the volcanic eruption is extremely hot and liquid initially, it is assumed that, during this liquid stage, the argon at that time is ‘boiled’ out of the rock so that any argon found in the rock is a result of the transformation of the radioactive potassium that has occurred since the time the rock solidified. The ‘age’ is determined by measuring the relative amounts of argon and potassium in the rock at the present time and doing a straightforward calculation to determine the length of time since the rock solidified.
However, this technique is notorious for giving answers of millions of years for the age of rocks formed by eruptions at recent, known time, e.g. Mount St. Helens. Samples from the lava dome, formed after the Mount St. Helens eruption, were dated8 using this technique using both the whole rock and individual mineral techniques mentioned by Dr Payne. The resulting whole rock ‘age’ was 350,000 years and the individual mineral ‘ages’ ranged from 340,000 to 2.8 million years At the time of the measurements, the rock was about 10 years old.
Table 1: K-Ar ‘ages’ for samples taken from lava dome formed after the Mount St. Helens eruption8
| Mineral | ‘age’ (millions of years) | “uncertainty” (millions of years) |
|---|---|---|
| whole rock | 0.35 | 0.05 |
| feldspar, etc | 0.34 | 0.06 |
| amphibole, etc | 0.9 | 0.2 |
| pyroxene, etc. | 1.7 | 0.3 |
| pyroxene | 2.8 | 0.6 |
Note also the associated ‘uncertainties’. These are all relatively small compared to the calculated ages, which would tend to suggest that, while the calculated ‘age’ may not be exactly correct, the correct answer most likely lies somewhere in this range. However, as explained earlier, these uncertainties are not measures of accuracy but rather of repeatability of the experimental procedure. In fact these results are a very good illustration of this point since the calculated ‘ages’ are definitely wrong.
Such ‘anomalous’ results are attributed to non-zero amounts of argon present initially. Of course, it is impossible to know just how much argon was present initially so it is not possible to determine the actual age. Equally importantly, if you did not know what the real age of the rock was (as a result of its formation having been witnessed), you would not be aware that the ‘age’ was incorrect. Since in most cases one does not know the real age, it would seem unreasonable to accept any K-Ar ‘age’ as being accurate. A very good account of how unreliable—and malleable—these dates are can be found in The pigs took it all which documents an actual case played out in the secular literature.
Clearly, since this technique relies on the measurement of just the single ratio of stable end-product isotope to radioactive isotope (daughter-to-parent), it is very sensitive to any quantity of end-product isotope (daughter) present initially. This sensitivity is largest when the age determination is being done very near the time of initial rock formation and has the largest absolute effect when the half-life of the radioactive isotope is very large. Given the scenario that earth is about 6,000 years old, this is exactly the situation we have for all the radioactive chains commonly used to date rocks. The magnitude of this impact for several commonly used decay chains is illustrated in Table 2.
Table 2: Impact on calculated age of the presence of a small amount of stable end-product isotope at time of rock formation for several commonly used decay chains in the scenario where the earth is only about 6,000 years old.
| Decay Chain | effective half-life (billions of years) | 6,000 years as fraction of half-life (expressed as billionths) | amount of radioactive isotope transformed in 6,000 years (expressed as number of atoms out of an initial 1 billion atoms) | ‘age’ calculated after 6,000 years with 1% daughter product present at time 0 (millions of years) |
|---|---|---|---|---|
| K-Ar | 1.25 | 4800 | 3326 | 18 |
| Rb-Sr | 47 | 128 | 88 | 675 |
| Sm-Nd | 106 | 57 | 39 | 1,522 |
| 235U-207Pb | 4.5 | 1333 | 924 | 65 |
| 238U-208Pb | 0.710 | 8451 | 5856 | 10 |
So the assumption of no stable end-product (daughter) present at rock formation is still an important one for some dating methods. Sufficiently important, in fact, that another radiometric dating technique was developed to try to address this. This technique is referred to as ‘Isochron Dating’.
Isochron dating is intended for use when, in addition to the radiogenic daughter, there is another stable isotope of the same end-product element. Two commonly used decay chains for which this is the case are Rb-Sr in which 87Rb decays to 87Sr and Sm-Nd in which 147Sm decays to 143Nd. In both cases there is another stable isotope of the end-product element, namely 86Sr and 144Nd respectively. With this technique, rather than measuring the ratio of the amount of radioactive parent isotope to radiogenic daughter isotope, the ratios of radioactive parent isotope to non-radiogenic daughter isotope (I’m going to refer to this as the ‘sister isotope’) and of the radiogenic daughter isotope to non-radiogenic sister isotope are measured. This pair of measurements is determined for a number of different samples of the same rock and these pairs are plotted on a two-dimensional graph.
Working through the mathematics for a well-behaved set of samples, this plot should result in a straight line, the slope of which is actually the ratio of radiogenic daughter isotope to radioactive parent isotope—the same relationship used in the previous technique to calculate the age. In this case, however, the assumption about the amount of radiogenic daughter initially present is not required.
Nevertheless there are other unverifiable assumptions about the past history of the rock that are implicit in the technique. Principally these are that the two end-element isotopes (daughter and sister) were initially present in all the rock samples in the same ratio and that this ratio has not changed during the history of the rock. This is similar to the assumption made in the technique described by Dr Payne concerning the relative abundances of the Pb isotopes. On the surface, this assumption seems reasonable as it is based on the assumption that initial rock composition and any subsequent changes will be effected by processes that depend on the chemical properties of the elements involved. Since the chemical properties of different isotopes of the same element are essentially the same, any processes manipulating the abundances of these isotopes could be expected to maintain the ‘natural’ ratios. If these assumptions are correct, then their validity should be evident from the dating results.
Figure 2 presents three isochron plots using three different decay chains, namely the two mentioned above (Rb-Sr and Sm-Nd) plus a third using the two decay chains of uranium to lead described by Dr Payne. In each case the graph of the measured ratios is seen to result in a pretty good straight line as expected from the theory. The ‘ages’ determined from the slopes of these lines are indicated on each graph together with the associated uncertainties. These uncertainties are related to the uncertainties in the calculated slope, which, in turn, are related to how closely the data points conform to the straight line relationship, which, in turn, are related to the uncertainties in the data points (indicated by the short vertical lines on each point or the small ellipses for the Pb-Pb). The uncertainties in the calculated ‘age’ are quite low, ranging from 2.4% to 6.8%.
 |
 |
 |
Figure 2: Sample isochron plots for three different decay chains with calculated ‘ages’ indicated. These all show well-fit straight lines as expected from the theory but are all for the same rock and do not agree with each other.
These ‘age’ determinations are all for the same rock—the Brahma amphiboles from the Grand Canyon, thus the ‘ages’ should all be the same, which they clearly are not.
If the three calculated ‘ages’ are assumed to be the means of three Normal (Gaussian) distributions of ‘age’ determinations that would result from a number of repeated measurements using the same decay chains and experimental techniques and the indicated uncertainties are assumed to be the standard deviations for these distribution, then the calculated ‘ages’ are different from each other by 3.43, 4.46 and 6.47 times the combined (rms) standard deviations taken in pairs. The probability of these differences occurring if the ‘ages’ were, in fact, the same, ranges from about 3 x 10⁻⁴ to about 10-10. Consequently, it seems reasonable to conclude that these three ‘ages’ are not the same. Since we have no idea what the real age of the rock is, it also seems unreasonable to conclude that any of these ‘ages’ is correct. In fact, they may all be wrong.
It is akin to measuring the thickness of a machined part with three different micrometers from three different manufacturers and getting three widely different answers. If the micrometers have not been calibrated using a piece of known thickness, then it is not possible to know that any of the measurements are correct. It is quite possible that all are wrong.
These results suggest that it is unreasonable to assume that any isochron ‘age’ is correct, regardless of the goodness of fit of the measurements to a straight line.
In summary, the assumptions concerning initial rock composition and closed system since formation are applicable to at least one radiometric dating technique, namely the K-Ar technique and has been shown repeatedly, by erroneous ‘ages’ for rocks of known ages, to be invalid. Furthermore, while the isochron technique is designed to accommodate unknown initial compositions, results using isochrons for different decay chains to determine the ‘age’ of the same rock give such widely different answers that this indicates that this technique is also highly suspect.
Assumption: Constant half-life
This brings us to the third assumption identified by Dr Payne and the only one that he claims applies to the technique that he uses. At approximately 1:07:45 of the video recording of his presentation, Dr Payne states that while it is impossible to prove that the decay rate has been constant over time [I agree], he knows of no evidence that it has changed. However, there are at least two papers in secular journals that present evidence of current change.9,10,11 These papers show a distinct annual variation of the half-lives (decay rates) of 60Co, 137Cs, 32Si and 226Ra and, consequently, falsify the assumption that half-lives (decay rates) are constant. While the variation is small (~1.8% for 60Co), this in no way precludes a larger variation in the past.
Ironically, evidence of variation in half-lives/decay rates in the past has also come from studies using zircon crystals. This is reported in another of the papers produced by the RATE project to which Dr Payne alluded in his fission track discussion.12 (More on fission tracks later.)
Granitic Precambrian rock from a deep bore hole being drilled in New Mexico by Los Alamos National Laboratory, was analyzed using the U-Pb decay chain, much like Dr Payne describes, to determine its ‘age’, with a result of 1.50 ±0.02 Ga (billion years).
As Dr Payne describes in his talk, zircon crystals are commonly found in granite, and uranium is preferentially encased in these crystals while lead is preferentially excluded. As illustrated in the slide in Dr. Payne’s presentation that shows the two U-Pb decay chains, when 238U decays to Pb, eight alpha particles are emitted during the process. These alpha particles (as Dr Payne notes in his talk) are actually helium nuclei. These capture 2 electrons and become helium atoms. Helium is the lightest noble gas, forms no natural compounds and has a very small effective radius. These characteristics combine to make it very easy for helium to diffuse through materials—as anyone who has purchased a helium-filled balloon knows only too well!
During the decay of the uranium in the zircon crystals, then, helium will build up in the zircon crystal as the uranium atoms transform to lead. As the concentration of helium in the zircon builds up, the helium will begin to diffuse out of the zircon crystal into regions of lower helium concentration. As time goes on, more and more helium will diffuse out tending to equalize the concentration everywhere.
Some of the core samples from the New Mexico borehole were sent to Oak Ridge National Laboratory for isotopic analysis. Zircon crystals were extracted from these samples and, after careful preparation, analyzed by heating to 1000 deg C in a mass spectrometer to determine the amount of helium retained in the crystals. It was found that as much as 58% of the helium that would have been produced by the amount of uranium that had decayed (indicated by the amount of lead present) was still retained in the crystal. (The amounts varied depending on the depth at which the crystal originated since deeper crystals would be at higher temperature and higher temperatures would increase the diffusion rate.)
This was much more helium than would have been expected given the radiometrically determined ‘age’ of the surrounding rock and the ease with which helium diffuses through stuff. Clearly the rate at which helium diffuses through zircon is an important parameter related to this observation, so the RATE scientists undertook to get some more zircon crystals from the same borehole and to have this diffusion rate measured by an independent third-party laboratory.
However, before doing this, two model calculations were undertaken. One calculated the expected results based on the age of the crystals being 1.5 Ga as indicated by the radiometric dating, the concentration of helium measured by the Oak Ridge analysis and the temperature at the depth at which the crystal was extracted. Another calculated the expected diffusion rate based on the same helium concentrations and temperatures but used an assumed age of 6,000 years. The results differed by a factor of about 100,000.

When the actual experimentally measured results were obtained from the independent laboratory, they agreed almost exactly with the predictions made assuming a 6,000 year age for the crystals—and, therefore, disagreed with the predictions made using the 1.5 Ga age, by a factor of 100,000.
This is summarized in Figure 3.
Clearly, either radioactive decay rates had been dramatically higher in the past or the rate of diffusion of helium through zircon had been dramatically lower.
The arguments against a lower rate of diffusion are many but one of these is that this would imply a considerably lower temperature for a considerable part of the past which is unlikely as the borehole is reasonably close to a former volcano which would suggest that the temperatures were actually warmer in the past. A more detailed discussion of concerns raised about the work and the responses to these can be found at references 13 and 14. Furthermore, data published in a secular journal on the levels of 40Ar from the radioactive decay of 40K in feldspar from the same borehole support the age of approximately 6,000 years for the granite.15
While there is strong evidence of a period of accelerated nuclear decay at some time in the past, there is no indication from these data as to when this may have occurred. Within the framework of biblical history, it is reasonable to consider that this may have occurred during the year of the global flood. This was clearly a catastrophic event involving widespread and intense geological activity requiring large amounts of energy to both initiate and sustain. Some (or possibly all) of this energy could have been provided by the energy released from a pulse of increased radioactivity.
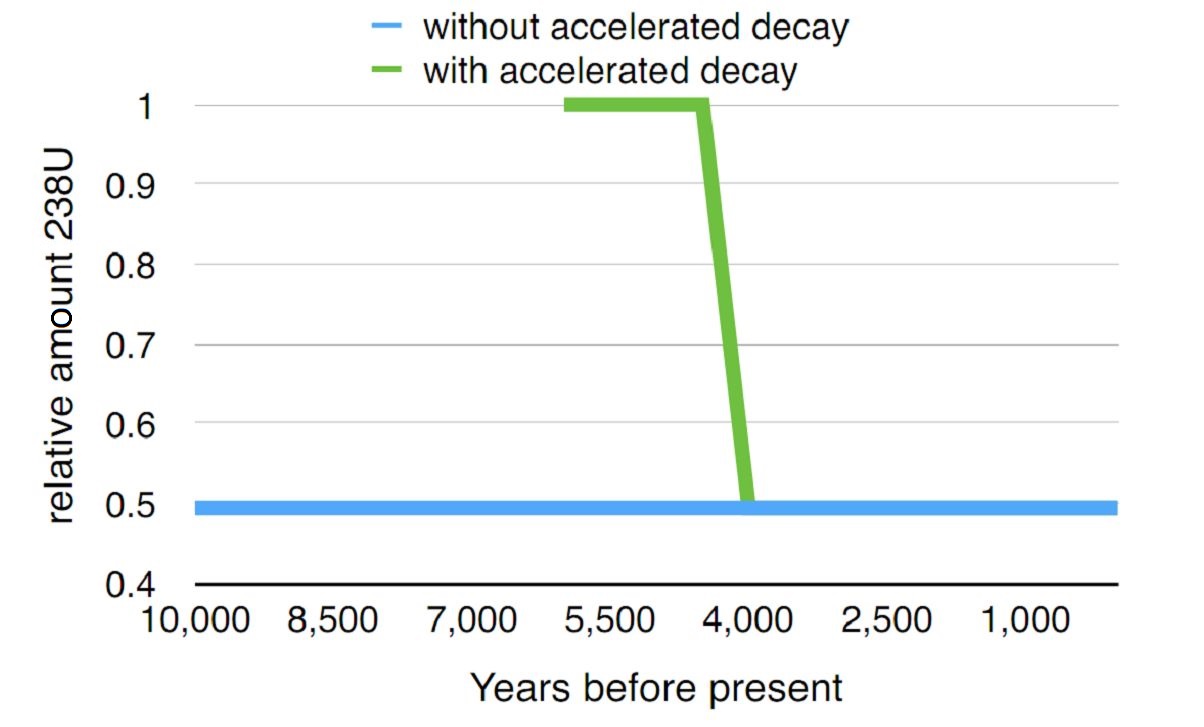
Given the two alternatives of (a) a 4.54 billion-year-old earth with unchanging radioactive decay rates or (b) a 6,000 year-old earth with dramatically speeded-up radioactive decay rates during the global flood described in the Bible, we can construct two graphs of the relative amount of radioactive parent isotope, say 238U, as a function of time. These are illustrated in Figures 4 and 5.
The initial amount of 238U is 1 in both cases. Without accelerated decay rates, the time origin is taken as 4.54 billion years ago and the effective half-life of 238U decay chain is taken as 4.468 billion years (the half-life for decay of 238U itself). In Figure 4 the time period from 10,000 years ago to the present is plotted with increments of 500 years. During this time period, the relative amount of 238U only varies from 0.49452090 to 0.49452013, a change of only 0.00016%. With accelerated decay rates, the time origin is taken as 6,000 years ago, approximately the time interval from creation to the present derived from the chronogenealogies in the Bible. From the origin to the time of the Flood—taken to be 1500 years later or 4,500 years ago (another approximation used for simplicity)—the 238U half-life is assumed to be its present value. The increased decay rate is assumed to have occurred during the year of the Flood, during which time the relative amount of 238U present would reduce to the same value that would result from the other scenario at the same time before the present. Following this, it is assumed that the half-life/decay rate stayed at its present value.
 |
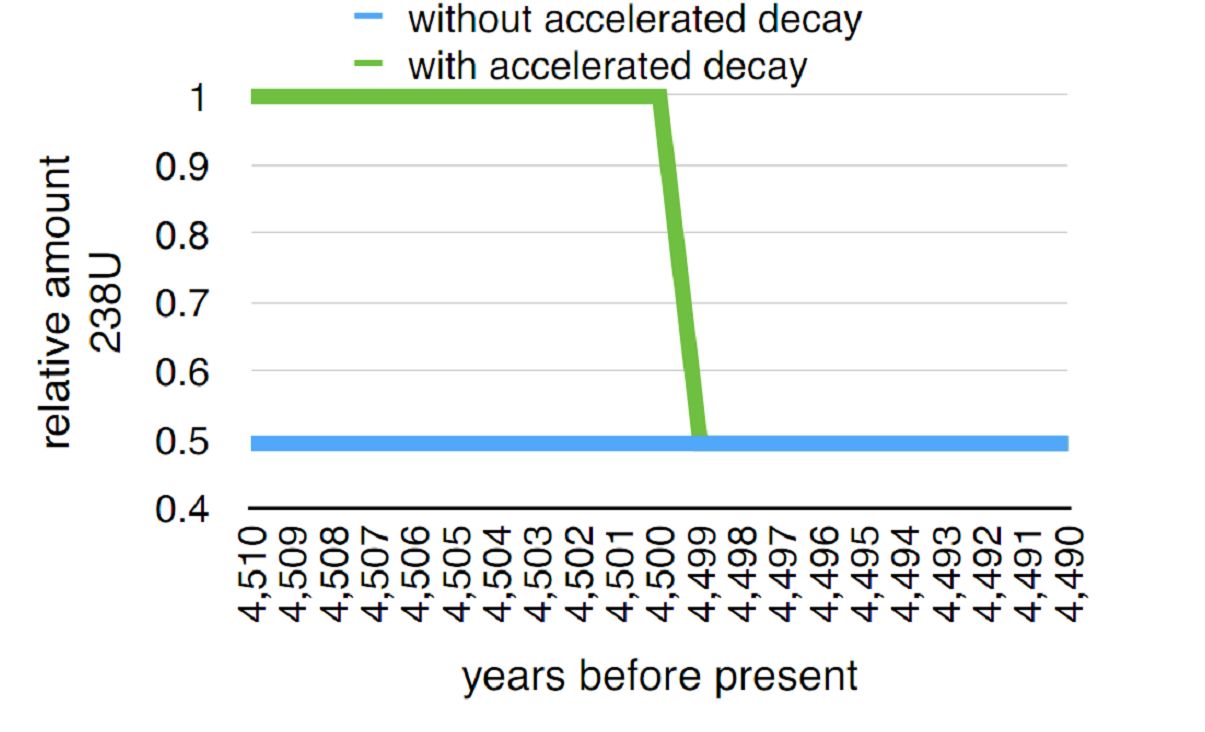 |
(Due to the limitations of the skill of the author of creating graphics for publication, Figure 4 shows this decrease occurring in the 500 years between 4500 and 4000 years ago whereas it would have occurred in just one year. Figure 5 is a magnification of the interval around the 4,500 years-ago point to show the decrease in the single year. Again due to the limitations of the author, the decrease during this year is shown as a straight line whereas it would actually have been an exponential decay.)
From the perspective of radiometric dating techniques that measure the present relative abundances of the radioactive parent isotope, the radiogenic end-product (daughter) isotope and the associated non-radiogenic end-product (sister) isotopes, it is impossible to differentiate between these two scenarios.
Given that recent measurements have shown that the uniformitarian assumption of an unchanging half-life/decay rate over time is incorrect, the shorter time frame scenario cannot be ruled out on the basis of an assumed constant decay rate. Moreover, the helium diffusion measurement and the argon diffusion measurement both indicate that the shorter time frame is correct.
While the helium diffusion measurement uses a by-product of the 238U decay process (the alpha particles), it uses a separate, independent (and independently measured) physical property of the surrounding crystal to determine the age. Although the alpha particles derive from the 238U decay, the number of them that are produced is independent of the rate at which they are produced and is, therefore, independent of the actual value of the 238U decay rate.
Moreover, the argon diffusion measurement is a second measurement, independent of the other two. While it also uses a radioactive decay product (40Ar), this is produced by a decay process unrelated to that which produces the helium (not only a different radioactive isotope—K vs. U—but a different decay mechanism—beta vs. alpha). And while it uses the same physical property (diffusion rate) that was used in the helium diffusion studies, it is for a different substance than that used for the helium diffusion determinations (feldspar vs. zircon).
So, in effect, the helium and argon diffusion measurements are akin to two different micrometers from two different manufacturers using two different measurement techniques. The U-Pb measurement is akin to a third micrometer from a third manufacturer using a third measurement technique. The first two agree with each other but the third agrees with neither. This strongly suggests (but does not guarantee) that the first two are providing the correct answer while the third has some design defect.
An assessment of the validity of this conclusion can be obtained from looking at evidence from other areas.
Other evidence for the shorter time frame scenario
There is considerable other evidence that supports the conclusion that the shorter time frame scenario is correct. Some of these are presented below. For a more complete list see Age of the earth: 101 evidences for a young age of the earth and the universe.16
Evidence from 14C radiometric dating of coal:17 The half-life of 14C (5730 years) is such that, if the entire earth were composed of 14C, it would have completely transformed into 14N (the associated daughter isotope) in less than a million years. The accelerator mass spectrometers used for 14C dating have an intrinsic detection sensitivity that corresponds to an ‘age’ of about 90,000 years. This means that anything older than this will have a level of 14C that is undetectable. Coal samples from layers in the geological column allegedly ranging in age from about 30 million years to over 300 million years were found to contain significant amounts of 14C, clearly indicating that the coal is only a few thousand years old. Furthermore, the coal samples all had roughly the same amount of 14C regardless of the geological layer from which they had been extracted, indicating that the vegetation that was buried to form the coal all grew at about the same time.
Evidence from 14C dating of diamonds:17,18 In the same study that looked at the level of 14C in coal, the level of 14C in diamonds was also measured. This turned out to be only slightly less than the level in coal, despite the ‘fact’ that diamonds allegedly ranged in age from 1 to 3 billion years.
Evidence from 14C dating of dinosaur bones:19,20,21 Dinosaur bones have been found to contain about the same amount of 14C as the coal samples mentioned above. This means that these bones cannot be 65 million years old or older as claimed, but are, rather, just a few thousand years old and are essentially the same age as the various coal samples.
Evidence from biological tissue found in dinosaur bones:22,23 Soft biological tissue has been found in numerous dinosaur bones of different types of dinosaurs. This tissue includes blood vessels, blood cells, various proteins, skin and even DNA. None of these tissues could survive for the alleged 65 million years since the dinosaurs supposedly went extinct and, in fact, their presence indicates that these bones are only a few thousand years old.
Evidence from genetics:24,25 Genetics research indicates that each member of each new generation of humans has 80–300 mutations not present in that member’s parents—plus, of course, all the mutations from each parent. Mutations are overwhelmingly deleterious. Most mutations produce no visible effect in the phenotype and, therefore, individually, have negligible effect on the individual’s ability to survive (“fitness”). However, the mutations accumulate and this increasing mutational load represents an inexorable decrease in overall fitness. Geneticists have estimated this decrease in fitness to be of the order of 1%–2% per generation. The ‘Out-of-Africa’ scenario for human dispersion around the globe has humans leaving Africa around 150,000 years ago. At 30 years per generation (studies often use 20 years, which would make the result worse), this corresponds to 5,000 generations. Even at a 1% decrease per generation, this would put our current “fitness” at a vanishingly small 1.5 x 10⁻²²! With a 6,000 year scenario at 30 years per generation, the current fitness would be about 13%. Using the genealogies in the Bible up to the time of Jesus and 30 years per generation since then, results in a current fitness of about 21%. Clearly, we are still surviving, so the first scenario must be incorrect. Either of the latter two is possible with the second one obviously being more probable. Both of these support the results discussed above.
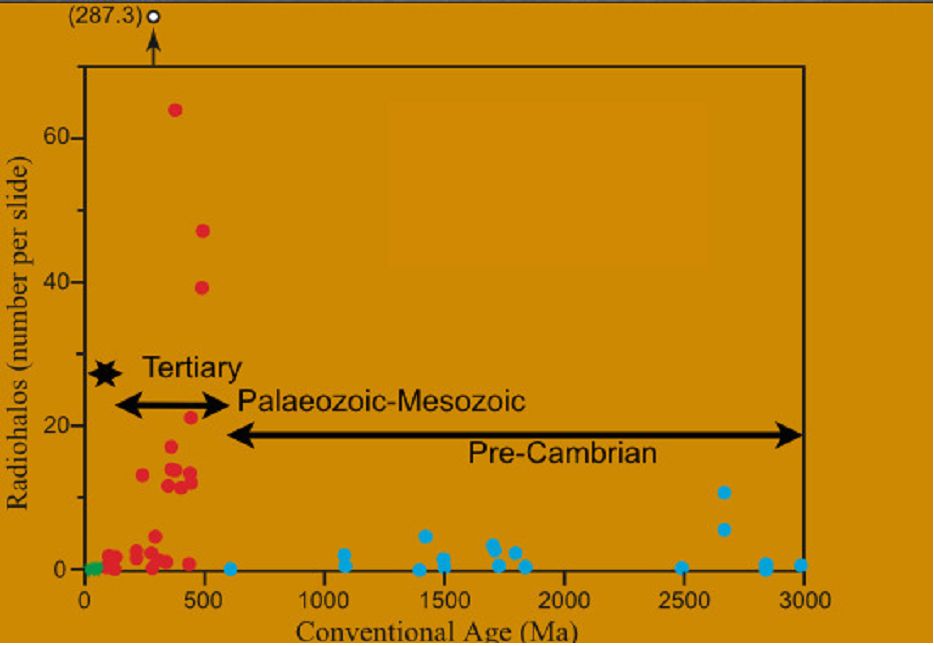
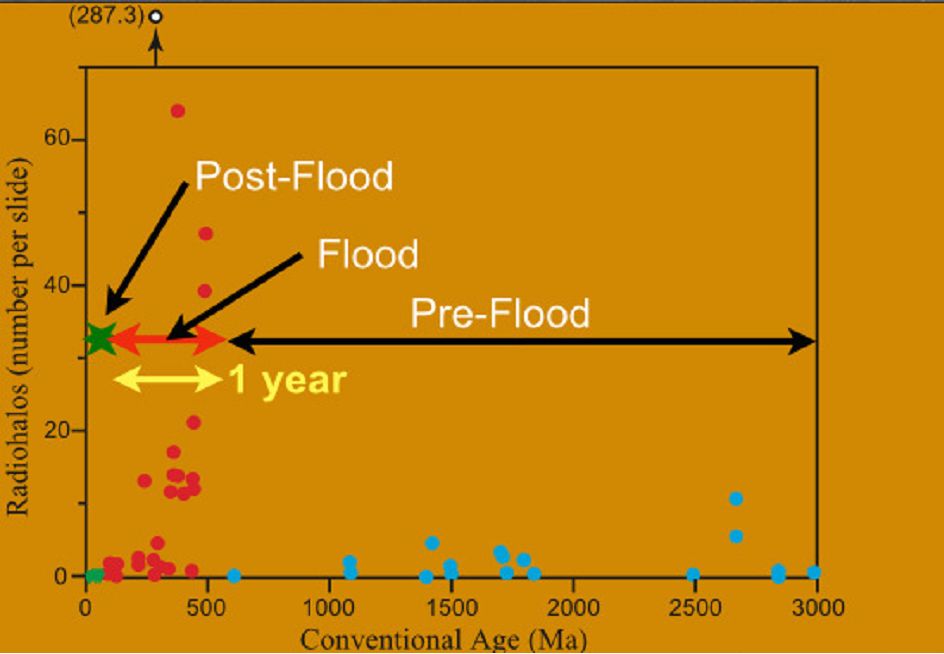
Evidence from radiohalos:26 Radiohalos result from the damage to surrounding crystal structure caused by the alpha particles emitted during radioactive decay. (Dr Payne erroneously refers to this as fission track damage during his Mount Ararat discussion. More about this later.) The alpha particles from a given decay transformation, e.g.238U- 234Th, have a characteristic kinetic energy. As they travel through the crystal structure radially outwards from the radioactive source, they collide with the atoms in the crystal structure, causing dislocations and gradually giving up energy and slowing down. When the energy is nearly depleted, the collisions become more numerous so that the alpha particle gives up a considerable fraction of its energy in a relatively short distance at a well-defined radius from the radioactive source, causing a great deal of crystal damage at this particular radius. With proper preparation, these damaged areas show up under a microscope as dark circles surrounding the radioactive source.
The RATE project included a detailed examination of 238U radiohalos in various granites. One of the observations was that the density of radiohalos showed a major spike in the granites that are geologically dated as being between about 100 million and 500 million years old relative to granites either ‘older’ or ‘younger’. (See Figure 6) Using the short time (6,000 year) scenario and scaling the rock ‘ages’ as pre-flood, flood and post-flood (as indicated in Figure 7) results in these high concentrations of radiohalos corresponding to a period of accelerated nuclear decay during the Flood (as hypothesized above), which would explain the dramatically increased densities.
 |
 |
Fission tracks
Very near the end of his presentation, Dr Payne references a paper from the RATE project concerning fission tracks. Dr Payne attributes these tracks to alpha particles, which is incorrect. As explained above, the alpha particles emitted in radioactive decay result in radiohalos.
(Since Dr Payne seems somewhat unsure just what RATE was, for the record, RATE, which stands for Radioisotopes and the Age of The Earth, was a research project conducted under the auspices of the Institute of Creation Research and The Creation Research Society and involved a number of scientists, one of whom, Dr Andrew Snelling, was the author of this particular paper on fission tracks.)27
Fission tracks are the record of crystal damage caused by the atoms that result when a uranium (or other) nucleus fissions, that is, splits into two (generally, very infrequently three or four) smaller particles. The two particles are not always the same but are distributed around mass numbers 95 and 135. The fission process, which is the process that powers nuclear power reactors and atomic bombs, releases prodigious amounts of energy, much of which is in the form of the kinetic energy of the two particles that are formed. These particles move off in opposite directions from the point of fission (because of the law of conservation of momentum) and cause damage to the crystal along these paths.
Like the radiohalos, the fission tracks can be made visible under a microscope with appropriate treatment of the affected crystal. The fission track density can then be counted and used as an indication of how much fission has occurred.
Dr Payne displays a quote from Section 11 Conclusions of the RATE paper and this is correctly quoted. It is repeated here for completeness.
“11. Conclusions
The observed fission track densities measured in zircons from samples of Cambrian, Jurassic and Miocene tuffs in the Grand Canyon-Colorado Plateau region were found to exactly equate to the quantities of nuclear decay measured by radioisotope age determinations of these same rocks. …
… Given the evidence in that strata sequence of catastrophic deposition and independent evidence that most of this strata sequence was deposited during the year-long global catastrophic Biblical Flood only 4500 years ago, the 500 million or more years worth (at today’s rates) of nuclear and radioisotope decay had to have occurred during the Flood year only 4500 or so years ago. Thus this nuclear and radioisotope decay had to have occurred at accelerated rates, and the fission tracks in the zircons in the tuffs within the strata sequence are physical evidence of that accelerated nuclear decay.”
Dr Payne points to the words “had to have occurred” as an indication that the conclusion was “forced” because of a belief in the Bible
However, the context of this conclusion is contained in Section 10, Discussion of the Overall Study, three pages earlier. This is, “Thus, if more than 500 million years worth of nuclear and radioisotope decay has occurred in zircon grains within the Cambrian tuff units during and since their deposition, then this is consistent with more than 500 million years of elapsed time only if the nuclear and radioisotope decay rates have remained constant at today’s measured rates throughout that elapsed time …” (emphasis in the original)
As we have seen there is considerable evidence that the “if” condition of the above statement is not true. While some of this evidence, notably the measurements that actually show decay rates varying on an annual basis,9,10 the argon diffusion evidence,15 the biological tissue in dinosaur bones22,23 and the 14C dating of dinosaur bones,23 was not available at the time of the project, the helium diffusion evidence, radiohalo evidence and evidence of 14C in coal was discovered as part of the RATE project and known to all the participants. Thus it is the statement, “independent evidence that most of this strata sequence was deposited during the year-long global catastrophic Biblical Flood”, in Section 11 (quoted by Dr. Payne), that leads to the conclusion that followed.
So, it seems to me, that rather than being “forced” (Dr Payne’s word) to come up with a particular explanation because of a belief in the Bible, the RATE scientists, including Dr Snelling, were “forced” to come up with an explanation based on the evidence and that explanation just happened to agree with what would be expected from a plain reading of the biblical account of history.
The Mount Ararat example
At the end of his presentation, Dr Payne uses an example based on Mount Ararat in an attempt, it seems to me, to refute the conclusions of the RATE team. However, this example is flawed in many respects.
To start with Dr Payne correctly notes that the Bible says that at the end of the flood, the “ark rested on the mountains of Ararat” (Genesis 8:4). However, he then proceeds on the premise that “the mountains of Ararat” = “Mount Ararat” or some similar volcanic mountain. He then takes the radiometric ‘age’ for Mount Ararat and adjusts it to account for the 500 million years of radioactive decay that occurred during the year of the Flood (by dividing the currently determined age by 500 million) to arrive at a ‘true’ age for Mount Ararat of just over a day. He does allow that Mount Ararat might have erupted in a day near the end of the Flood, but implies then that the Ark would have come to rest on a recently erupted (and therefore very hot and inhospitable to life) and still active volcano.
However, “the mountains of Ararat” is non-specific. It would be like saying “the mountains of New South Wales” or “the Blue Mountains”. In the latter case, the mountains would be sandstone (sedimentary origin) rather than volcanic. Of course, the Blue Mountains are not in the Middle East, where it is expected that the Ark came to rest. However, even here there are ample non-volcanic mountains that could have been called “the mountains of Ararat”. For example, the Zagros Mountains along the border of Iraq and Iran are fold mountains of rocks of sedimentary origin pushed up by the collision of the Iranian and Arabian plates. Applying the Catastrophic Plate Tectonics model developed by Dr John Baumgardner,28 the sedimentary layers for these mountains would have been laid down during the early part of the Flood and then pushed up while they were still plastic by the rapid and highly energetic plate movement. The Ark could easily have come to rest on one such mountain.
Furthermore, people live in Hawaii adjacent to volcanoes that are ‘erupting’ frequently. While these pose some hazard, they clearly don’t make the Hawaiian islands uninhabitable. However, clearly, some volcanic eruptions are disastrous. So even if the Ark did come to rest on or near a recently erupted volcano (which is certainly arguable), the hazard associated with that would depend on the nature of the most recent eruption.
The significance of the name “Mount Ararat” is likewise debatable. If I were to say that I lived in a small cottage on the banks of the Avon River not far from Stratford, one might think that I lived in England. But I could equally as well live in Ontario, Canada. Immigrants from England named the Canadian river and community after places which they knew from their past, even though these places bore no physical resemblance to each other, nor were they spatially close. Mountains named ‘Ararat’ today could also be so named and yet bear no physical resemblance or spatial proximity to what is referred to in the Bible as ‘the mountains of Ararat’. Indeed, there is even a Mt Ararat in Australia in the state of Victoria.
Dr Payne notes that the ‘age’ he used of Mount Ararat was an “Ar-Ar” age. That means that the ‘age’ has been based on the K-Ar decay chain and we have seen how unreliable that is. However, more fundamental than that, that decay chain for this technique is either β+-decay or electron capture whereas the decay chain used in the zircon studies is U-Pb, and a completely different process, fission, was the basis of the fission track studies.
The β-decay process involves either the transformation of a neutron in the nucleus into a proton and an electron followed by the expulsion of the electron from the nucleus, or a transformation of a proton in the nucleus into a neutron and a positron followed by the expulsion of the positron from the nucleus. In the case of electron capture, it involves the capture of an electron external to the nucleus (most likely from the 1s shell) and the transformation of a proton into a neutron. In the parlance of the Standard Model of particle physics, these processes are governed by the Weak Nuclear force which is mediated by the W and Z gauge bosons.
The U-Pb decay chain is a mix of both alpha decays and beta decays. However, the half-life is driven by the alpha decays. The three longest half-lives in the total chain are, respectively, 4.468 x 10⁹ years, 2.445 x 10⁵ years and 7.54 x 10⁴, followed by 1,600 years, also an alpha decay. Alpha decay proceeds by an alpha particle (two protons and two neutrons), which is normally contained within the nuclear potential well, tunnelling through the well wall and ‘escaping’ to the outside. In Standard Model parlance, this process is governed by the Strong Nuclear force which is mediated by the gluon gauge bosons. The fission process is also governed by the Strong Nuclear force.
Since the beta and alpha decay modes are governed by different fundamental forces, there is no need for them to have experienced the same effect. Beta decay rates could be altered by changes to one or more of the parameters of the W and/or Z gauge boson; alpha decay rates could be independently altered by changes to one or more of the properties of one or more of the gluon gauge bosons. Thus, conclusions reached about the degree of acceleration of alpha decay need not apply at the same value to beta decay acceleration. However, since fission and alpha decay are governed by the same fundamental force, they would be expected to show the same degree of acceleration.
Furthermore, since the alpha decay rate is quite sensitive to the (non-linear) shape of the edge of the nuclear potential well, it might be expected that the acceleration experienced by various alpha emitters might not be proportional to any change in the Strong Nuclear force. Alpha emitters of high mass number might be expected to experience a greater impact for a given force change.
So, with reference to Figure 4, the sequence with respect to Mount Ararat would be as follows:
- primordial amount of radioactive parent is created during Creation Week
- this begins to decay according to the presently measured half-life. (The half-life could have been different; this does not change the essence of the argument.)
- during the year of the Flood, the rate of radioactive decay is factored up substantially and (potentially) differently for beta emitters than for alpha emitters and fission processes
- the rocks ‘age’ during this period to essentially the apparent ages they appear to have today
- in particular, magma so ‘ages’ and volcanoes erupt at various times during the year trapping various and unknowable amounts of argon when they harden quickly, with the 40K continuing to decay at its enhanced rate until the end of the period.
- at the end of the Food, the decay rates return to their present values.
The net effect of this is that the rocks, including the lavas from volcanic eruptions regardless of when these occurred during the Flood, appear to have the ages that they currently appear to have using the naturalistic, uniformitarian dating methods and assumptions.
Anticipating objections that
- there is no known process that could change the decay rate that significantly and
- this sounds like a ‘just-so’ story ‘required’ by a belief in the Bible
I would note the following.
This objection should really be stated as: “There is no known naturalistic process that could change the decay rate that substantially”. However, it is certainly known that some naturalistic process does exist that can change decay rates—of both alpha and beta emitters.9,10 So from a naturalistic perspective, it is only a question of degree, not existence. Furthermore, the naturalistic explanation of things is replete with instances that invoke unknown and, in some cases, unknowable processes and entities, in order to explain observed phenomena. Some examples of these are: baryogenesis, cosmic inflation, dark matter, dark energy and abiogenesis. In some cases no process is even hypothesized, as in the appearance ex nihilo of genetic information. So from a purely naturalistic perspective, this objection fails.
But as we saw earlier, limiting explanations about the origin of things to only naturalistic explanations can actually preclude arriving at the correct explanation. If we expand our solution space to include possible action by the God of the Bible, it is quite reasonable to imagine such a process affected by minor alterations to one or more properties of some of the gauge bosons.
- In response to this objection, I would repeat the Lewontin quote:
“Our willingness to accept scientific claims that are against common sense is the key to an understanding of the real struggle between science and the supernatural. We take the side of science in spite of the patent absurdity of some of its constructs, in spite of its failure to fulfill many of its extravagant promises of health and life, in spite of the tolerance of the scientific community for unsubstantiated just-so stories, because we have a prior commitment, a commitment to materialism.“It is not that the methods and institutions of science somehow compel us to accept a material explanation of the phenomenal world, but, on the contrary, that we are forced by our a priori adherence to material causes to create an apparatus of investigation and a set of concepts that produce material explanations, no matter how counter-intuitive, no matter how mystifying to the uninitiated. Moreover, that materialism is an absolute, for we cannot allow a Divine Foot in the door.”
So, it would seem, ‘just-so stories’ are not incompatible with what is considered good science under the naturalistic presupposition—especially if they enable one to avoid having to consider the possibility of the “Divine”. And there are many such stories: the just-so story of the Big Bang, particularly the cosmic inflation aspect but also others, the just-so story of abiogenesis, the just-so story of biological evolution, which seems to need frequent major revisions, even reversals, as new bits of evidence are discovered, the just-so story of the survival of biological tissue (by some unknown process, by the way) for millions of years in dinosaur bones, and so on. So, it seems to me, just-so stories should not be excluded, a priori, from another explanation based on another presupposition.
Moreover, this other explanation is based on hard scientific evidence that the earth is only a few thousand years old and consistent with much other data indicating that the earth is not millions of years old. This evidence is not readily explained under the naturalistic presupposition without the use of many ‘unsubstantiated just-so stories’.
So this objection also fails.
Summary:
- one needs to distinguish between evidence derived using the scientific method (i.e. measurements that are verifiable by repeated experimentation) and the interpretations of this evidence;
- one needs to distinguish between the sort of science that explores/discovers how the universe operates and the sort of ‘science’ that attempts to explain how things came to be;
- one needs to understand the nature of the presuppositions underlying the interpretation of data and the impact this has on the interpretation;
- presuppositions that limit the solution space being considered, such as the naturalistic presupposition that underlines current scientific effort, can preclude being able to arrive at the correct solution/explanation;
- the ‘uncertainties’ reported for scientific results are measures of repeatability, not accuracy. Accuracy can only be assured when the measurement tool/technique has been calibrated using a sample with independently and unequivocally known characteristics. Accuracy can be assessed when multiple independent measurement tools/techniques are used to determine the same quantity.
- The two radiometric dating assumptions dismissed by Dr Payne are, in fact, applicable to some techniques.
- The one assumption accepted by Dr Payne as being applicable to the radiometric dating technique he uses and describes in his presentation, is known to be wrong. While small, the observed variation applies to both alpha emitters and beta emitters and means that larger variations in the past cannot be ruled out a priori.
- There is scientific evidence from radioactive decay by-products that is free of any assumption about the decay rate and uses an independent physical property of the surrounding material that the earth is only a few thousand years old.
- There is evidence from a separate radioactive decay process resulting from a different fundamental force that is also free of any assumption about the rate of the decay process and uses an unrelated physical property of the (different) surrounding medium, that agrees with the few-thousand year age of the earth.
- There is evidence from radiometric dating using the short half-life 14C decay chain that coal and dinosaur bones are only a few thousand years old.
- There is evidence from radiohalo and fission track analysis that agrees with an age of a few thousand years for the earth.
- There is evidence from genetics and palaeontology (soft tissue in dinosaur bones) that indicates that humans have been around for only a few thousand years and that dinosaurs lived a few thousand years ago.
- There is considerable other evidence that the earth is not billions of years old.
- The objection raised by Dr Payne using the Mount Ararat example fails.
Conclusion
Dr Payne starts and ends his presentation with the following slide:
“My Opinion is for two viable alternatives
- The earth is ca. 4.5 billion years old
- The earth is ca. 6,000 years old and it was created in such a manner that the geological record provides evidence for the earth being ca. 4.5 billion years old.
Not a Flood ‘Geology’ scenario”
I submit that the geological record shows considerable evidence that the earth is actually about 6,000 years old, including:
- measurements of the amount of radiogenic helium retained in zircon crystals from deep in the earth’s crust
- measurements of the amount of radiogenic argon retained in feldspar in granites from deep in the earth’s crust.
- measurements of the amount of radiocarbon in coal from various layers in the geological column
- measurements of the amount of radiocarbon in diamonds from rock deep in the earth’s crust
- measurements of the amount of radiocarbon in dinosaur bones from various layers in the geological column
- discovery of various soft biological tissues in dinosaur bones found in various layers in the geological column
In addition, there is considerable evidence, both geological and other, that the earth is very much less than 4.54 billion years old that is consistent with the earth being 6,000 years old. Furthermore, there is considerable geological evidence that is consistent with there having been a global flood (not discussed explicitly here but see, for example, the many articles at Geology Questions and Answers29) but that requires numerous ‘unsubstantiated just-so stories’ to explain if the earth is 4.54 billion years old.
Consequently, using the courtroom scenario discussed earlier in which one set of evidence is interpreted on the basis of two different presuppositions/assumptions and a decision is made as to which interpretation best explains the evidence and, therefore, which underlying assumption is most likely correct, I would re-state Dr Payne’s slide as the following ‘judicial’ opinion.
My opinion:
Given the following two hypotheses:
- that the earth is ca. 4.54 billion years old, or
- that the earth is ca. 6,000 years old,
I would conclude that there is clear and convincing evidence to support the second hypothesis.
Some evidence (derived from radioactive decay), when interpreted using assumptions known to be invalid (or, at least, highly suspect), an interpretative framework (uniformitarianism) known to give erroneous answers in commonplace situations and a presupposition (naturalism) known to preclude correct explanations, can be misinterpreted as indicating that the earth is ca. 4.54 billion years old.
However, to interpret the bulk of the evidence under the first hypothesis requires numerous unknown processes, several of which contradict known laws of physics and chemistry, as well as many disjointed, ‘unsubstantiated just-so stories’.
Consequently I find in favour of the second hypothesis, which is, of course, a biblical scenario.
References and notes
- Geochronology Radioactive Dating Methods, reasonablefaithadelaide.org.au/geochronology-radioactive-dating-methods. Return to text.
- Geochronology: understanding the uncertainties, reasonablefaithadelaide.org.au/wp-content/uploads/2014/06/Geochronology.pdf. Return to text.
- Radioactive Dating Methods, youtube.com/watch?v=XvfxDgAtbE0, 7 Nov 2014. Return to text.
- Cosner, L., What distinguishes origins and operational science?, creation.com/distinguish, 2013. Return to text.
- Hutton, J., Theory of the Earth with Proof and Illustrations, 1795; cited in: Holmes, A., Principles of Physical Geology, 2nd edition, Thomas Nelson & Sons, London, p. 43, 1965. Return to text.
- Nicholas Steno (1638–1686), ucmp.berkeley.edu/history/steno.html. Return to text.
- Sagan, C., The Demon-Haunted World: Science as a Candle in the Dark, 1997. Reviewed by Richard Lewontin, The New York Review, p. 31, 1997. Return to text.
- Swenson, K., Radio-dating in rubble, Creation 23(3):23–25, 2001, creation.com/rubble. Return to text.
- Baurov, Y. A. et al., Experimental investigations of changes in β-decay rate of 60Co and 137Cs, Physics of Atomic Nuclei 70(11):1825–1835, 2001. Return to text.
- Jenkins, J. H. et al., Evidence of correlation between nuclear decay rates and Earth-Sun distance, Astropart. Phys. 32:42–46, 2009 | doi:10.1016/j.astropartphys.2009.05.004. Return to text.
- Sibley, A., Radioactive decay rates and solar activity, J. Creation 27(2):3–4, 2013; creation.com/decay-rates. Return to text.
- Humphreys, D. R., Young Helium Diffusion Age of Zircons Supports Accelerated Nuclear Decay, in Radioisotopes and the Age of the Earth Volume II, edited by Vardiman, Snelling and Chaffin, Institute of Creation Research, El Cajon, CA and Creation Research Society, Chiro Valley, AZ, pp 25–100, 2005. Return to text.
- Humphreys, D. R., Russ Humphreys refutes Joe Meert’s false claims about helium diffusion, creation.com/meert. Return to text.
- Humphreys, D. R., Helium evidence for a young world continues to confound critics, 2008; creation.com/helium-critics. Return to text.
- Humphreys, D. R., Argon diffusion data support RATE’s 6,000-year helium age of the earth, J. Creation 25(2):74–77, 2011; creation.com/argon-diffusion. Return to text.
- Batten, D., Age of the earth: 101 evidences for a young age of the earth and the universe, 2009; creation.com/age-of-the-earth. Return to text.
- Baumgardner, J. R., 14C Evidence for a Global Flood and a Young Earth, in Radioisotopes and the Age of the Earth, Volume II (Edited by Vardiman, Snelling, and Chaffin), Institute of Creation Research, El Cajon, CA and Creation Research Society, Chiro Valley, AZ, pp 587–630, 2005. Return to text.
- Sarfati, J., Diamonds: a creationist’s best friend: Radiocarbon in diamonds: enemy of billions of years, Creation 28(4):26–27, 2006; creation.com/diamonds. Return to text.
- Wieland, C., Radiocarbon in dino bones: International conference result censored, 2013; creation.com/c14-dinos. Return to text.
- Nelson, V., Untold Secrets of the Earth: Flood Fossils. Reviewed by Gary Bates, creation.com/flood-fossils-book, 2014. Return to text.
- A comparison of δ13C and pMC values for ten Cretaceous to Jurassic dinosaur bones, a presentation by Dr Thomas Seiler at the AOGS-AGU (WPGM) 2012 conference in Singapore, 15 August 2012. (See: Carbon-14 dated dinosaur bones-under 40,000 years old, https://www.youtube.com/watch?v=QbdH3l1UjPQ, accessed Dec 2014). Return to text.
- Sarfati, J., DNA and bone cells found in dinosaur bone, 2012; creation.com/dino-dna. Return to text.
- Smith, C., Dinosaur soft tissue, 2014; creation.com/dino-desperation. Return to text.
- Sanford, J. C., Genetic Entropy (4th Edition), FMS Publications, New York, 2014. Return to text.
- Carter, R. W., Adam, Eve and Noah vs Modern Genetics, 2010; creation.com/noahgenes. Return to text.
- Snelling, A. A., Radiohalos in Granites: Evidence for Accelerated Nuclear Decay, in Radioisotopes and the Age of the Earth, Volume II. (Edited by Vardiman, Snelling, and Chaffin), Institute of Creation Research, El Cajon, CA and Creation Research Society, Chiro Valley, AZ, pp 101–207. Return to text.
- Snelling, A. A., Fission Tracks in Zircons: Evidence for Accelerated Nuclear Decay, in Radioisotopes and the Age of the Earth, Volume II. (Edited by Vardiman, Snelling, and Chaffin), Institute of Creation Research, El Cajon, CA and Creation Research Society, Chiro Valley, AZ, pp 207–324. Return to text.
- Baumgardner, J., Catastrophic plate tectonics: the geophysical context of the Genesis Flood, J. Creation 16(1):58–63, 2002; creation.com/cpt-flood. Return to text.
- Geology Questions and Answers. Return to text.


Readers’ comments
Comments are automatically closed 14 days after publication.