

Journal of Creation 33(3):66–76, December 2019
Browse our latest digital issue Subscribe
Baraminology suggests cryptic relationships among Caprimulgiformes
Caprimulgiformes is a group of five bird families including animals such as nighthawks and nightjars. At first sight they morphologically resemble owls. However, a study of 390 Kbp in 198 birds seemingly shows that they are more similar genetically to a group of birds called Apodiformes, which include swifts and hummingbirds. Why is there such a big disparity between morphology and genomics? The aim of this study was to combine both genomics-based and morphology-based baraminology methods to decipher the baraminic relationships between 87 species of birds from Caprimulgiformes, Strigiformes, and Apodiformes. Genomics-based methods include the analysis of mitochondrial DNA data, whole proteomes by the Gene Content Method, whole genome sequences by the Whole Genome K-mer Signature method, and a morphological data set by the BDIST method. Preliminary results indicate that Aegothelidae clusters with Apodiformes, based on morphology and genetics. Caprimulgiformes likely clusters with Strigiformes based on genetic results. Nyctibiidae needs more analysis. Podargidae and Steatornithidae cluster together and away from Apodiformes.
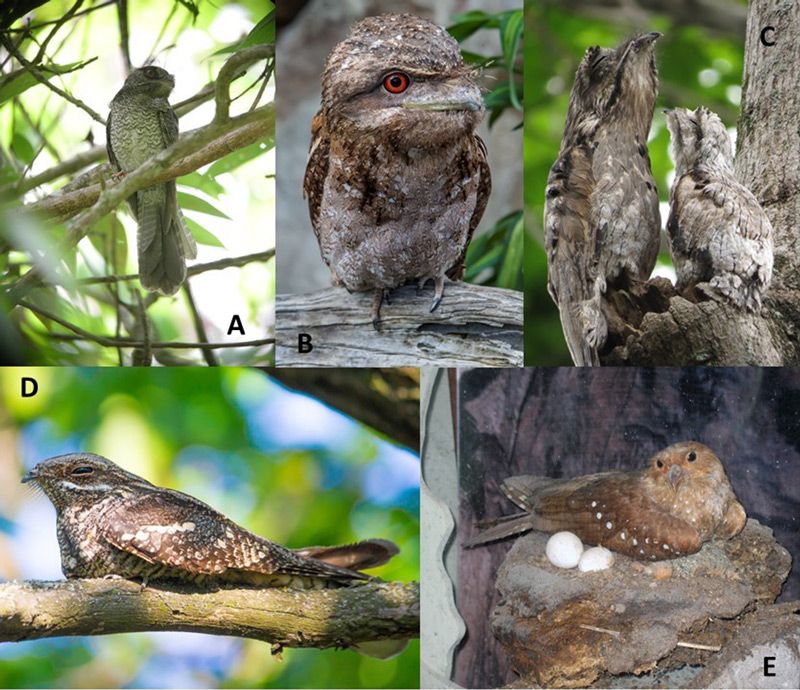
The avian order Caprimulgiformes, as traditionally constituted, includes 130 species in five families: Caprimulgidae, nightjars or nighthawks (97 species); Nyctibiidae, potoos (7 species); Steatornithidae, oilbird or guacharo (1 species); Podargidae, frogmouths (16 species); and Aegothelidae, owlet-nightjars (9 species).1 They are characterized by cryptic colouration, lax plumage, small beaks with a large gape, and small feet. Most have moderately long wings and tails for maneuverability in flight. See figure 1 for representative species from each family.
Our Creator has designed them for a narrow behavioural niche. They are the only avian group that is almost exclusively crepuscular (active mainly at dawn and dusk). Despite having large eyes and tapida lucida (a layer of tissue directly behind the retina), they are not capable of foraging visually in darkness and are only uncommonly seen abroad by day (except for some Chordeiles species that are diurnal as well as crepuscular). Although they can hunt on fully moonlit nights, their needs are met primarily during a four-hour period of the day, two hours near dusk and two near sunrise. Some data indicate that nightjars may time their breeding to coincide with a full moon for maximum provisioning of their young. Unlike owls they do not possess the acute hearing to enable prey location solely by sound. The oilbirds do use a form of echolocation to find their way in caves where they nest, but this consists of audible clicks that are not fine-tuned in the manner of bats.
During the day, nightjars roost in leaf litter or on branches where they mimic a broken stump. While the eye seems to be closed, the birds can see through a narrow slit between the upper and lower eyelids. The potoos are unique in possessing two tiny slits in the upper eyelid through which vision is possible while the large yellow eye itself is not visible. This design was called the “magic eye” by Sick who pictured it on page 300 of his book.2
The early work on the relationships of the Caprimulgiformes is summarized by Sibley and Ahlquist.3 Most systematists have not seriously questioned the monophyly of the group. Their nearest relatives have been thought to be either the owls (Strigiformes) or the swifts and hummingbirds (Apodiformes). The DNA hybridization data of Sibley and Ahlquist supported a relationship to the owls, with the exception of a long branch to the Aegothelidae.
The phenomenon of long branches and short internodal lengths (perhaps statistically insignificant) is a feature of the Sibley and Ahlquist ‘tapestry’ and, indeed, a problem for most molecular phylogenies. If such nodes were to be collapsed, the result would not be a ‘tree’ but a ‘bush’ or a ‘starburst’ suggestive of nearly simultaneous branching events. The evolutionists are coping with this by deriving hypotheses that relate the phenomenon to the Cretaceous-Tertiary (K-T) extinction event (‘catastrophic meteorite’ or ‘extraterrestrial holocaust’ idea).4,5 Creationists are aware that such simultaneous radiations of bird kinds are likely the result of the cessation of the Noahic Flood.
The Caprimulgiformes, as identified in the introduction, are at least paraphyletic. The Aegothelidae consistently cluster with the swifts and hummingbirds. The study by Chen et al. incorporates data from morphology (including fossil taxa) and independently derived genome sequences.6 The authors combine the swifts and hummingbirds (Apodiformes) and owlet-nightjars (Aegotheliformes) into a larger group called Daedalornithes. To this they add the remaining caprimulgiform groups to form an umbrella crown-group, Strisores.7-9
Mayr carried out a study of the osteology of the group, including fossil forms, using parsimony.10 His results concurred with a possible relationship of the Aegothelidae with swifts and hummingbirds. A cursory examination of his figure 4 showing photographs of the skulls of Aegotheles and Apus demonstrates the similarity of their wide, lightly built skulls.
Excluding the Aegothelidae, opinions differ as to the arrangement of the other four caprimulgiform taxa. A clade of ‘Steatornithidae + Nyctibiidae’ is favoured by many authors.4,7,11-13 Mayr’s osteological analysis suggests a clade of ‘Nyctibiidae + Caprimulgidae’. The sequence of clades also differs among the various studies, implying a lack of congruence overall.
One might suspect, on the basis of zoogeography, that the Neotropical oilbird and potoos are closest to each other and to the Caprimulgidae, and that the Asian and Australo-Papuan Podargidae and Aegothelidae are each other’s near relatives. The newer data, as we have seen, do not uniformly support such a hypothesis, prompting a need for additional clarifying information.
This brief survey attests to a general concordance of opinion from studies of genome sequencing and detailed morphological analyses performed mainly in the last two decades. These studies are all based on phylogenetic (hence evolutionary) suppositions. The field is open for the exploration of new data in the form of proteomes and the application of statistical baraminological analyses that do not make evolutionary assumptions. The present study provides new data bearing on some of these questions.
Purpose of study
Christopher Emerling is an evolutionary biologist studying long-term genetic adaptations at the University of Montpellier in France, and hosts a blog titled “Evolution for Skeptics”. Referring to a study by Prum et al.7 on a segment of DNA around 390 Kbp in 198 different bird species, Emerling claims that species of Strigiformes are closer to birds, such as toucans, trogons, and eagles, than Caprimulgiformes.
On the other hand, this same study seemingly shows that Caprimulgiformes is closest to a group of birds called Apodiformes, which includes hummingbirds and swifts. Hummingbirds have long tails, wings which are capable of hovering flight, eat nectar, and are colourful, quite in contrast to caprimulgiforms. Swifts are highly aerial birds, with small legs and short tails. Emerling asks why these two groups of birds (Caprimulgiformes and Apodiformes) look so different, despite their DNA similarity. Shouldn’t Caprimulgiformes be more similar to owls rather than Apodiformes? If, based on DNA similarity, Caprimulgiformes and Apodiformes hypothetically come from the same created kind, then why did they diverge so much over the past 6,000 years?
Description of methods
It should be pointed out that the size of the DNA segment from the Prum et al. study was only 390 Kbp,7 whereas the smallest genome size of birds from the mentioned four groups is approximately 1,067 Gbp. This means that Prum et al. studied only about 0.037% of the entire genomes of these birds. Based on the very small size of the DNA, it is much too early to draw any strong conclusions about the genetic relationship between these four bird groups.
In contrast, two molecular baraminology algorithms have recently been developed which predict baraminic membership based on whole proteomics information (the Gene Content Method) as well as comparisons between WGKS. Since these two algorithms take global genomics/proteomics information into account, obviously they would be a preferable analysis for drawing baraminic conclusions about Accipitriformes, Apodiformes, Caprimulgiformes and Strigiformes. This paper applies the Gene Content Method14 to the proteomes of several species from these four bird groups, and the WGKS method15 to the whole genome sequences of species belonging to these groups. Additionally, a mitochondrial DNA comparison and the BDIST algorithm run on a morphological data set were performed on species mainly from Apodiformes and Caprimulgiformes, but also a smaller group of species from the other taxa as well. This way we can get a more comprehensive picture of the relationships between these four bird groups.
Results
Biblical considerations
Leviticus 11:13–19 lists some unclean birds: “And these you shall detest among the birds; they shall not be eaten; they are detestable: the eagle, the bearded vulture, the black vulture, the kite, the falcon of any kind, every raven of any kind, the ostrich, the nighthawk, the sea gull, the hawk of any kind, the little owl, the cormorant, the short-eared owl, the barn owl, the tawny owl, the carrion vulture, the stork, the heron of any kind, the hoopoe, and the bat” (ESV). Table 1 (adapted from Bulmer, 198916) summarizes the translations of these 20 birds from the King James Version (KJV), the New English Bible (NEB), and the English Standard Version (ESV).
From this list we can see that the Bible mentions falcons (Accipitriformes), owls (Strigiformes), and nighthawks (Caprimulgiformes), which are members of three of the four bird groups in this study. However, it is not clear as to whether owls or caprimulgiforms form one or more kinds. The three Bible versions mention four (KJV), eight (NEB), and five (ESV) species of owls/caprimulgiforms. It is interesting to note that where both the KJV and ESV use the word nighthawk for the Hebrew tahmās, the NEB uses the word short-eared owl. This means that nighthawks might be related to owls.
These 20 birds are listed as examples of either birds of prey, or birds which eat worms, carrion, or other impure substances. Birds which eat carrion might be carriers of disease, and birds of prey kill other animals, which is a symbol of the Fall into sin, making them unclean.17 Birds from Apodiformes, the swifts and the hummingbirds, eat nectar and insects, the latter of which do not count as nephesh life (sentient animals). This might be another indication that nighthawks, the single Caprimulgiformes species mentioned in the list, does not belong to Apodiformes.

Mitochondrial genome alignments
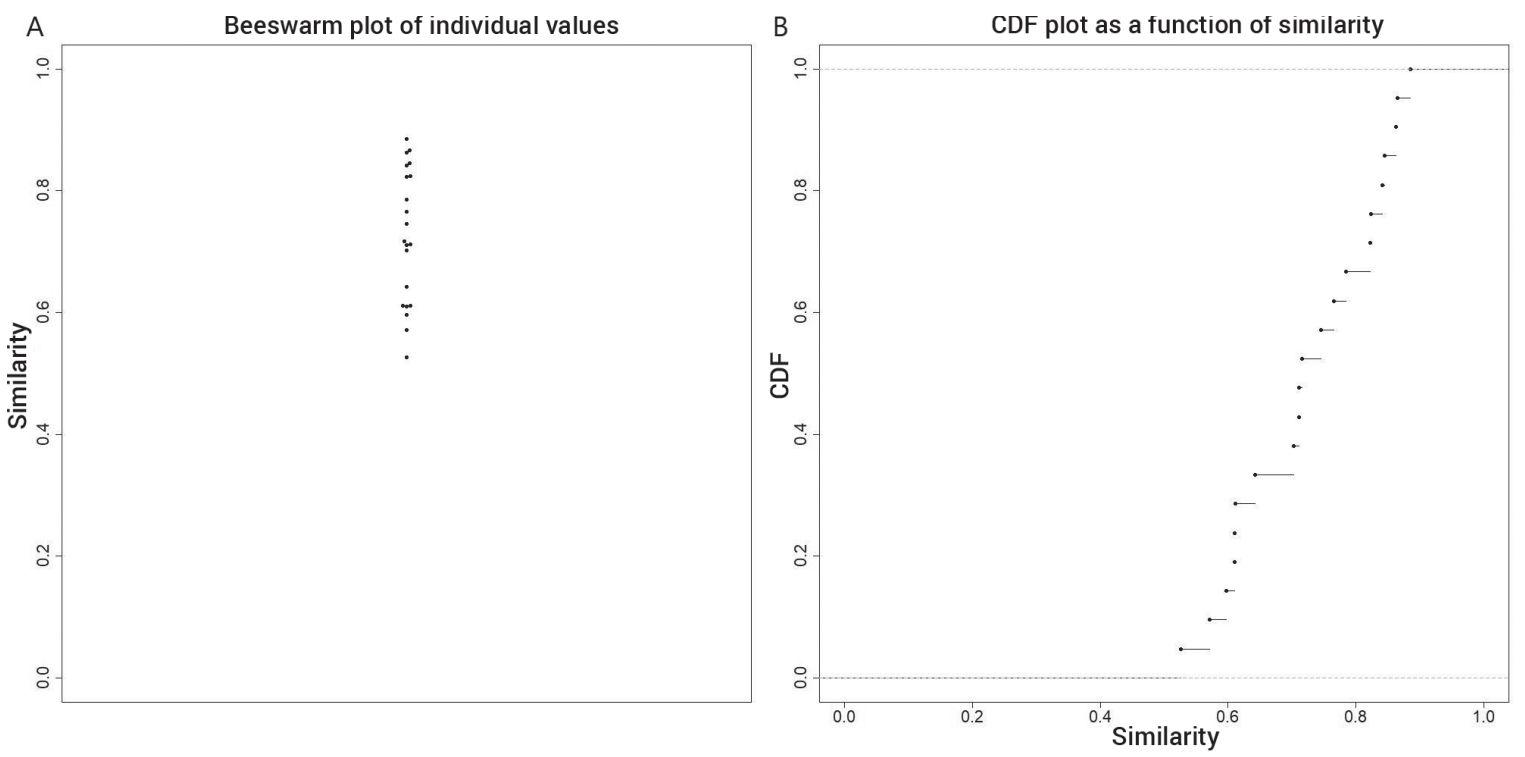
The mitochondrial genome sequences for 57 species from the four orders Accipitriformes, Apodiformes, Caprimulgiformes, and Strigiformes were downloaded from the NCBI database with Gallus gallus as an outlier. The NCBI Reference Sequence ID as well as the mtDNA length were noted for each species in Supplementary File #1. A multiple alignment was performed for all 57 of these mitochondrial genomes. The sequence identity matrix has been visualized as a heatmap18 in figure 2. Figure 3 depicts the beeswarm plot19 and the ECDF plot of the identity values from the heatmap.
In figure 2, several groups of different sizes are visible, as well as a number of species which seem to be singletons (species clustering by themselves). The baramins predicted by k-means clustering (k = 12) can be seen in table 1. 53 of the 56 (94.6%) non-outlier species were clustered successfully into a group, where all groups had a p-value < 5%. Gallus gallus, an outlier species, was by itself.
The first group (cluster #2) contains eight species, which include species from the strigiform genera Asio, Glaucidium, Otus, Phodilus, and the caprimulgiform Caprimulgus indicus (the jungle nightjar). Since C. indicus clusters together with these species, it might indicate that caprimulgiforms and some owls form the same baramin. Of the previously mentioned five genera, the first three belong to the family Strigidae, whereas Phodilus seems to be misplaced on the heatmap in figure 2. This species belongs to the other family of owls, Tytonidae.
The two Asio species, A. flammatus and A. otus, are in very different positions from one another on the heatmap. These two species have an identity value of 0.814. However, two other owl genera show similar identity values, yet they cluster together. For example, in the genus Otus, O. bakkamoena has an identity value of 0.834 and 0.815 between O. scops and O. sunia. There is also an identity value of 0.869 between Bubo bubo and Bubo scandius.
Table 1. Translation of individual bird species from Leviticus 11:13–19 in several Bible translations (adapted from Bulmer, 1989).16

The second group (cluster #3) contains nine species, which belong to the genera Accipiter, Buteo, Circus, Haliaeetus, and Milvus. These birds all belong to the family Accipitridae, subfamily Accipitrinae.
The third group (cluster #4) consists of three species from the owl genera Strix and Tyto. These two genera belong to the two extant owl families Strigidae and Tytonidae.
The fourth group (cluster #5) consists of five species from the two apodiform genera Amazilia and Hylocharis. These two genera belong to the family Trochilidae (hummingbirds).
The fifth group (cluster #6) is problematic. It consists of six species, which all belong to different orders: Aegotheles cristatus is one of the two caprimulgiform species, yet it clusters together with three apodiform species (Apus apus, Chaetura pelagica, and Cypseloides fumigatus), and two accipitriform species (Cathartes aura and Sagittarius serpentarius). The two accipitriform species also belong to their own families, Cathartidae (New World vultures) and Sagittaridae (the secretarybird). Since these two species cluster away from all other accipitriforms, they might each form their own individual baramins. Lightner classifies these two families as separate baramins.20 However, on the heat map, the three apodiform species cluster together, with the two accipitriforms and A. cristatus only loosely associated with them. Mahmood et al. classify this species into Apodiformes, also based on mtDNA evidence.21 If only the three apodiforms are used, the mean sequence identity is 0.851 (with a range of 0.844–0.861) as opposed to the mean value of 0.801 with all six species. If the three apodiforms and the two accipitriforms are treated as two separate groups, we get a mean inter-group sequence identity of 0.788. If the three apodiforms are compared to A. cristatus alone, the mean sequence identity is 0.791. Comparing these two sets of intergroup sequence identity values with a Student t-test gives us a p-value of 0.5425, meaning that the three apodiforms do not cluster preferentially with either the two accipitriforms or A. cristatus. Therefore, it might be more prudent to classify the Apus apus, Chaetura pelagica, and Cypseloides fumigatus all together into their own group.
The sixth group (cluster #7) is made up of four species in three genera, which all belong to the family Trochilidae. These are Florisuga fusca, Florisuga mellivora, Glaucis hirsutus, and Phaethornis malaris.
The seventh group (cluster #8) consists of nine species, eight of which belong to the subfamily Accipitrinae (family Accipitridae), whereas one species (Pandion haliaetus) belongs to the subfamily Pandioninae (ospreys). The eight accipitrine species include species from the genera Gyps (vultures), Aquila, Hieraaetus, Nisaetus, and Spilornis (eagles).
The eighth group (cluster #9) consists of six species of various apodiform genera: Archilochus colubris, Calliphlox amethystina, Chrysolampis mosquitus, Heliodoxa aurescans, Lophornis magnificus, and Oreatrochilus melanogaster.
Lastly, the ninth group (cluster #12) consists of three species from the strigiform genus Ninox, from the family Strigidae.
In total, the mitochondrial genome analysis results in two putative accipitriform baramins, four putative apodiform baramins, and three putative strigiform baramins. One of the two caprimulgiform species, Caprimulgus indicus was classified together with owls.

The beeswarm plot in figure 3A shows the spread of CC values from 0 to 1. The bulk of the CC values lie between 0.4 and 0.8. There are smaller clumps of CC values at 0.45, 0.55, 0.65, and 0.7. These correspond to humps on the ECDF plot of the CC values in figure 3B.
Gene Content Method analysis
Table 2. Baramins predicted by the k-means algorithm from the mitochondrial genome alignment.
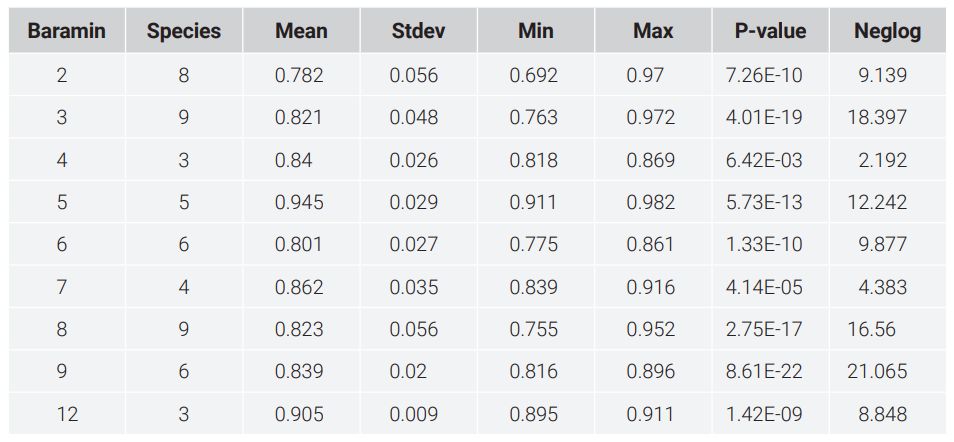
Table 3. Species used in the Gene Content Method analysis.

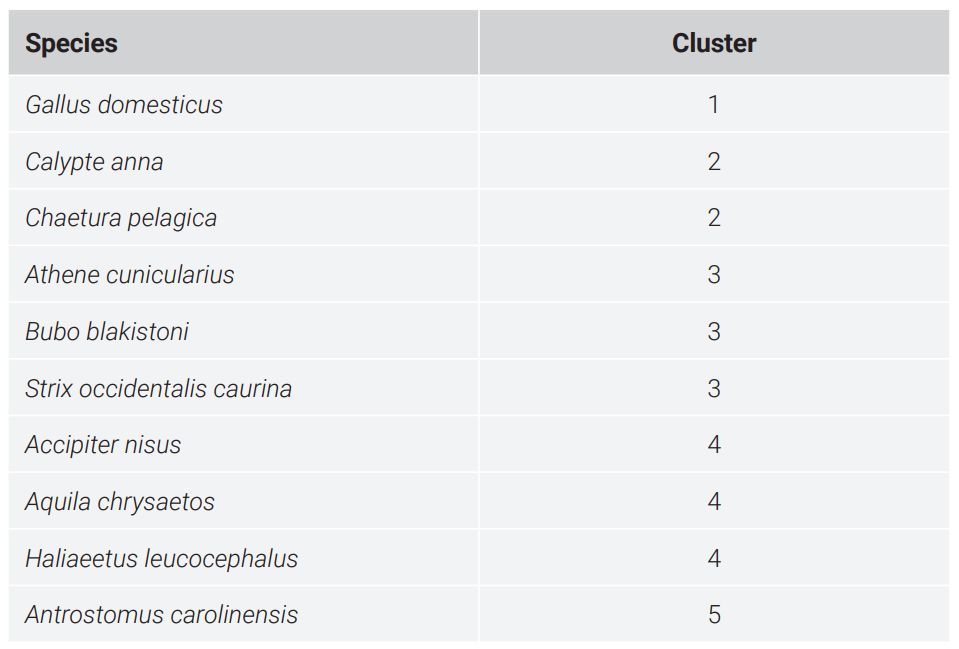
Table 2 shows the seven species used in the GCM method. Gallus domesticus was used as an outlier. According to protocol, the whole proteomes of these species were mapped to orthology groups using the OrthoMCL algorithm on the EuPathDB website. Hits with a minimum of 75% similarity were selected. The number of proteins in the proteome of each species and the number of hits to the OrthoMCL database are also recorded in table 3. Supplementary File #2 contains the JCV matrix for all species.

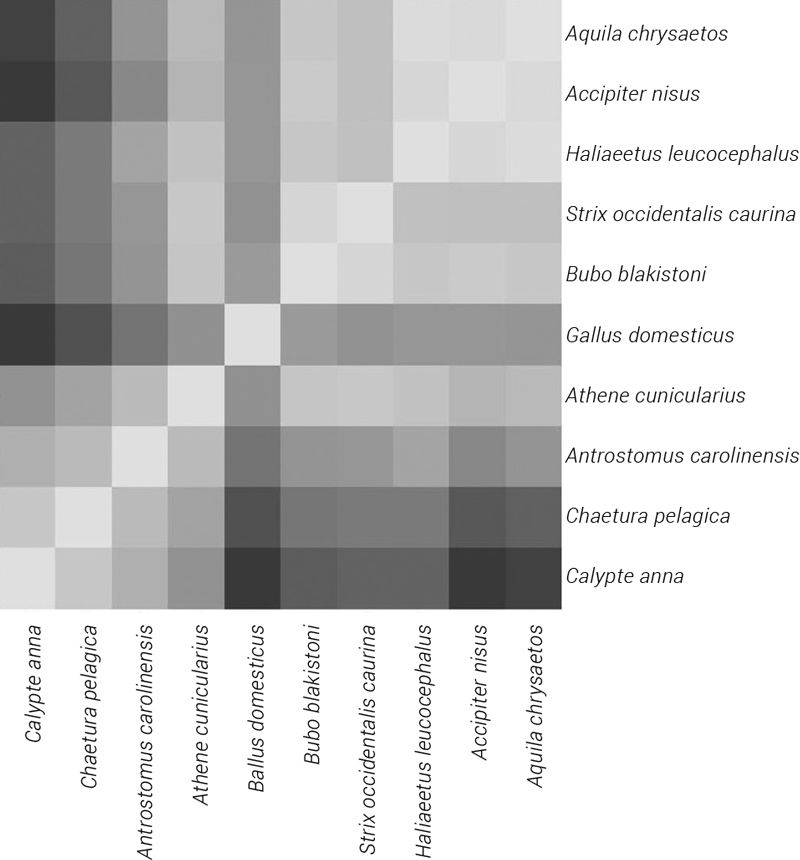
Figure 4 depicts a heatmap of the seven species used in this study. Using the k-means clustering algorithm as a part of the GCM method, four clusters were predicted. The number of species being too low, and the number of predicted groups being relatively too high, not many decisive conclusions can be made. Table 3 describes classification of six species into different groups based on the Gene Content Method. Figure 5 depicts the beeswarm and ECDF plots for the JCV values depicted in the heat map of figure 4. There is a small cluster of JCV values above 0.8, which also corresponds to a hump on the ECDF plot at the right side of the plot.
Despite the small number of species in this study, we can still see that the two apodiform species, Calypte anna (Anna’s hummingbird) and Chaetura pelagica (the chimney swift) cluster together. What is also notable is that all three owls cluster into their own separate groups. Furthermore, Antrostomus carolinensis (the Chuck-Will’s Widow), the only species from Caprimulgiformes in this analysis, clusters together with Tyto alba, one of the owl species. This suggests that some Caprimulgiformes and some owls could belong to the same baramin.
Whole Genome K-mer Signature analysis
The whole genome sequence for 13 bird species from the four main groups were downloaded. Three species, Cathartes aura, Haliaeetus albicilla, and Tyto alba were excluded since they had genome coverage < 30x. Therefore, the Whole Genome K-mer Signature (WGKS) algorithm was used on the 10 remaining species. Gallus domesticus was used as an outlier. The species names, their corresponding group, as well as the length of their genome sequence and their genome coverage can be seen in Supplementary File #3.
The WGKS algorithm was run for decamers (k = 10). Decamers are already long enough so they can give a very specific WGKS (there are 1,048,576 possible decamers). A Pearson Correlation Coefficient matrix (CC) was calculated for these 10 species, which is also available in Supplementary File #3. K-means clustering was run on these CC values to predict baramins. Three groups and two singleton species came out of this analysis according to the k-means clustering, as seen in figure 6. The species and the putative clusters they belong to are seen in table 4. Two putative clusters with at least three species are listed in table 5. Figure 7 depicts the beeswarm and ECDF plots for the JCV values depicted in the heat map of figure 6. The CC values cluster tightly together. No separation is visible.
The two apodiforms, Calypte anna and Chaetura pelagica, form a pair. The three strigiforms also form a group, with a p-value of 0.0008. The three accipitriforms also form a group, with a p-value of 2.7E-07. The caprimulgiform species, A. Carolinensis, clusters by itself and groups neither to the apodiforms nor to the strigiforms. Gallus domestics, the outlier species, also does not cluster with any other species.
Morphology studies using the BDIST method
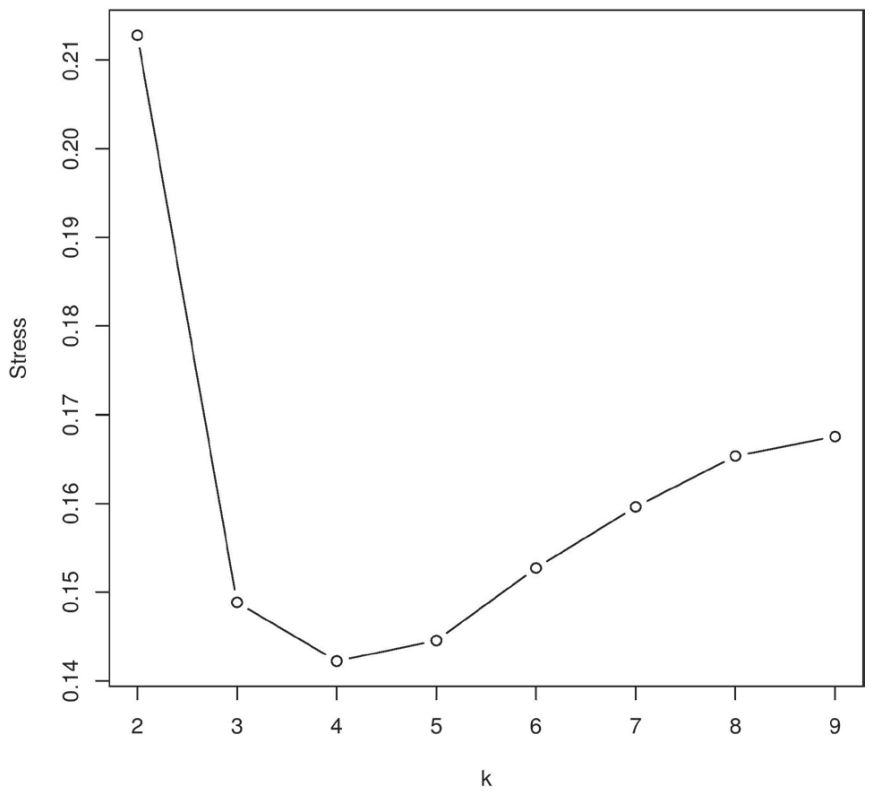
Morphological data for 17 extant and fossil Apodiformes and Caprimulgiformes species including 107 characters from a study by Nesbitt et al. (five were excluded, see Materials and Methods)22 were analyzed by the BDIST software using a character relevance cutoff of 0.75. Figure 8 depicts the baraminic distance correlation (BDC) matrix. Black squares denote continuity between two species, and white circles represent discontinuity between a pair of species. According to the stress graph (figure 9), there is a minimal stress value of 0.142 at four dimensions. These groups are described in the following.
The first putative baramin is made up of four species: three apodiforms, Amazilia tzacatl, Hemiprocne comata, and Aerodramus vanikorensis, and the owlet-nightjar Aegotheles cristatus. These four species show continuity with one another, and show discontinuity between the third, fourth and fifth groups (especially the third group), but not with the second group.
Table 4. Classification of 10 species according to the Whole Genome K-mer Signature method.
The second putative baramin is made up of four species: Nyctibius grisues, Nyctibius grandis, the unclassified species Caprimulgus carolinensis, and the fossil species Paraprefica kelleri. These species show continuity with one another, but discontinuity only with the third group.
Table 5. Baramins predicted by the k-means algorithm from the WGKS analysis.

The third putative baramin is made up of three species from the family Podargidae, namely Batrachostomus auratus, Podargus strigoides, and Masillapodargus longipes, as well as three species from the genus Fluvioviridavis. These species are continuous with one another, but discontinuous with the first and second group.
The fourth putative baramin is made up of six species from Steatornithidae, Eurofluvioviridavis undulates, the fossil species Prefica nivea (Steatornithidae), three species of Fluvioviridavis, and Steatornis caripensis. These six species show discontinuity with the first two groups, but interestingly, they show continuity with members of the third group. Therefore it is likely that we can consolidate groups three and four into a single baramin.
Figure 10 shows the MDS graph for 17 species in this study. There are two groups which separate well enough from all of the other groups: Apodiformes in medium grey (swifts+hummingbirds, including A. cristatus) and Nyctibiidae in light grey (potoos). Podargidae (frogmouths, dark grey) and Steatornithidae (oilbirds, dark grey) cluster together and seemingly form a single group.

Discussion
The main issue of this study is to find the true baraminic status of species from the order Caprimulgiformes. Whereas multiple lines of evidence were used to perform the most thorough analysis as possible, many species simply lacked sufficient data to be included. Based on evidence from mitochondrial DNA, whole proteome content comparisons, and Whole Genome K-mer Signature comparisons, at least some of these species might be closer to Strigiformes than they are to Apodiformes, and vice-versa.

There are 220–225 extant species of owls, which belong to two families, Strigidae and Tytonidae. Several fossil owl families have also been discovered, which differ somewhat from extant owls. The phylogenetic trees based on the cytb and the RAG-1 genes suggest there are at least two baramins corresponding to the two owl families.23 Of the 13 Strigiformes species in this study, Phodilus badius belongs to the family Tytonidae, which is separated from all the other 12 species, which belong to Strigidae. It could be possible that before the Flood, there were several kinds of owls, with a larger diversity of species than what we have today. As such it might be possible that some species of Caprimulgiformes also belonged to this diversity of owl species, even though they are somewhat different in morphology to owls. It might be that certain parts of the potentiality region (the multidimensional morphospace which defines the position of all possible species within a given baramin) between Strigiformes and certain Caprimulgiformes went extinct during the Flood. For example, whereas frogmouths (Podargidae) are restricted today to Australasia, they had a much wider geographical distribution in the past.22
The owl species all separated fairly well from the accipitriform species. Based on mitochondrial results, the families Cathartidae and Sagittaridae also separate from all of the other accipitriforms, therefore it is likely that they form their own baramins. Based on their own mtDNA studies, Jiang et al. 24 found that these two groups do not belong to Accipitridae. The mitochondrial DNA results showed that two species from the genus Butastur form their own cluster. However, these two species show the highest similarity to Haliaeetus albicilla and Milvus migrans, meaning that they may belong to the Accipitridae holobaramin.
Several studies indicate that Caprimulgiformes form a polybaramin, meaning that this taxon is not monophyletic. Such studies include genetic analyses on the gene cytb.10,25 Therefore, it may be possible that some caprimulgiforms belong to an owl baramin, others belong to an apodiform baramin, and others may form their own baramins.
In the family Caprimulgidae, the species A. carolinensis (also known as Caprimulgus carolinensis, or the Chuck-Will’s-Widow) clusters with Strigiformes based on the GCM results. However, based on the WGKS method, it clusters by itself. Based on the morphological analysis, it clusters with Nyctibiidae (potoos). It may be that this single genus (Caprimulgus) does not have any special characters which would warrant it being treated as a separate genus.26 The other Caprimulgidae species, Caprimulgus indicus, clusters well with Strigiformes based on the mtDNA study. Since genomics data is stronger evidence than morphology, this may suggest that Caprimulgidae belongs to an owl baramin, probably Tytonidae.
Species from Aegothelidae are not well studied and there is not much data about them. Sibley and Monroe placed this family as well as all caprimulgiforms into the order Strigiformes based on DNA-DNA hybridization studies.27 Lightner puts them into their own baramin.18 Based on molecular and morphological similarities, some researchers place these species into the order Apodiformes.28,29 This study also shows similar results, clustering A. cristatus with three apodiform species, Apus apus, Chaetura pelagica, and Cypseloides fumigatus based on mitochondrial DNA similarity results. The BDIST analysis also shows similar results.

For 12 potoo, frogmouth, and oilbird species, only morphological data were available. These results suggest that frogmouths and oilbirds cluster together to form their own baramin, away from apodiforms. As mentioned earlier, potoos cluster with A. carolinensis. Nyctibiidae is not continuous with apodiforms, but neither is it discontinuous with it.
A study by Iwaniuk et al. describes the difference in cerebellum morphology of the five caprimulgiform families.30 This is important, because brain anatomy reflects differences in behaviour and ecology. According to this study, apodiforms, nightjars, owlet-nightjars, and potoos have relatively small anterior lobes and large posterior lobes, which is the opposite of owls, frogmouths, and oilbirds. Folia I-III of the cerebellum in apodiforms is reduced, whereas these folia are fully formed in owls. Owls have a folia Va and Vb, whereas apodiforms have a single folia V.
Conclusion
In conclusion, we can answer Emerling’s questions in the following way: the order Caprimulgiformes is not monophyletic, nor a holobaramin (being above the level of family). Rather it is a polybaramin, containing species from five families, belonging to two or more holobaramins. It is possible that some of these species belong to Apodiformes, and some to Strigiformes, and yet others belong to their own separate baramin. Results from the BDIST study on the morphological data from Nesbitt et al. seem to indicate that some caprimulgiforms are morphologically more similar to Apodiformes than to Strigiformes. Therefore, any kind of morphological similarity between them and Strigiformes may be due to superficial similarities as exist between dolphins, sharks, and ichthyosaurs.
Table 6. Classification of the five different caprimulgids in this study.

These results are summarized in table 6. Based on genetic and morphological similarities, Aegothelidae belongs to Apodiformes. Based on DNA similarity, Caprimulgidae likely belongs to Strigiformes. However, based on morphological studies, it is continuous with Nyctibiidae. Even though Nyctibiidae does not show continuity with Apodiformes, it still is not discontinuous with it. Podargidae and Steatornithidae both cluster together and are discontinuous with Apodiformes. This means they either form their own baramin or could possibly still cluster with owl baramins. Further studies based on genetic comparisons would be useful.
Further study is needed to clarify the relationships between these groups. More complete data sets, including complete proteomes and whole genome sequences, would be needed for more Caprimulgiformes species.
Materials and Methods
Mitochondrial DNA study
The whole mitochondrial genome sequence for 57 species of Accipitriformes, Apodiformes, Caprimulgiformes, and Strigiformes, plus Gallus gallus, were downloaded from the NCBI website at ncbi.nlm.nih.gov/genome/browse#!/ organelles/. After correcting sequencing errors, these sequences were submitted to Clustal Omega at ebi.ac.uk/Tools/msa/clustalo/.
Whole proteome and Whole Genome K-mer Signature analyses
The JaccardClusters.R script was used to run in Linux the Gene Content Method, which is available at github.com/csmatyi/JCV. Whole proteomes were downloaded from the Uniprot website at uniprot.org/. The proteomes were uploaded to the EuPath Galaxy Site at eupathdb.globusgenomics.org/. The k-means clustering algorithm, the BT plot31, the heatmap, and the beeswarm plot were generated for both the whole proteome analysis and the Whole Genome K-mer Signature analysis using the k-means clustering R script available at github.com/csmatyi/kmeansClustering. The Python script motif-analysis.py was used for the Whole Genome K-mer Signature analysis, available at github.com/csmatyi/motif_analysis. All of the supplemental data files and figures are available on github at github.com/csmatyi/caprimulgiformes.
Morphological analysis
The BDIST software was used for the morphology study at coresci.org/bdist.html.32,33 A character relevance cutoff value of 0.75 was used. Quercypodargus olsoni was excluded because it had no overlapping characters with Masillapodargus longipes. Four species were excluded since they belonged neither to Apodiformes nor to Caprimulgiformes. These species are Crypturellus undulates, Eurypyga helias, Leptosomus discolor, and Trogon massena. This species had values for only four characters. Results for the baraminic distance correlation graph were retrieved and are available in Supplementary Data File #4.
References and notes
- Gill, F. and D. Donsker (Eds.), IOC World Bird List (v 9.2), 2019; worldbirdnames.org/. Return to text.
- Sick, H., Birds in Brasil: A natural history, Princeton University Press, Princeton, NJ, 1993. Return to text.
- Sibley, C.G. and Ahlquist, J.E., Phylogeny and Classification of the Birds of the World: A study in molecular evolution, Yale University Press, New Haven, CT, 1990. Return to text.
- Longrich, N.R., Tokaryk, T., and Field, D.J., Mass extinction of birds at the Cretaceous–Paleogene (K–Pg) boundary, PNAS USA 108:15253–15257, 2011. Return to text.
- Field, D.J., Berv, J.S., Hsiang, A.Y., Lanfear, R., Landis, M.J., and Dornburg, A., Timing the extant avian radiation: the rise of modern birds, and the importance of modeling molecular rate variation, PeerJ Preprints, 2019, peerj.com/preprints/27521/. Return to text.
- Chen, A., White, N.D., Benson, R.B.J., Braun, M.J., and Fi, D.J., Total-evidence framework reveals complex morphological evolution in nightbirds (Strisores), Diversity 11:143, 2019 | doi:10.3390/d11090143. Return to text.
- Prum, R.O., Berv, J.S., Dornburg, A., Field, D.J., Townsend, J.P., Lemmon, E.M. et al., A comprehensive phylogeny of birds (Aves) using targeted next-generation DNA sequencing, Nature 526(7574):569–573, 2015. Return to text.
- Kimball, R.T., Oliveros, C.H., Wang, M., White, N.D., Barker, F.K., Field, D.J., Ksepka, D.T. et al., A phylogenomic supertree of birds, Diversity 11:109, 2019. Return to text.
- Jarvis, E.D., Mirarab, S., Aberer, A.J., Li, B., Houde, P., Li, C., Ho, S.Y.W. et al., Whole genome analyses resolve early branches of the tree of life of modern birds, Science 346:1320–1331, 2014. Return to text.
- Mayr, G., Phylogenetic relationships of the paraphyletic ‘caprimulgiform’ birds (nightjars and allies), J. Zool. Syst. Evol. Res. 48(2):126–137, 2009. Return to text.
- Hackett, S.J., Kimball, R.T., Reddy, S., Bowie, R.C.K., Braun, E.L., Braun, M.J., Chojnowski, J.L., et al., A phylogenomic study of birds reveals their evolutionary history, Science 320:1763–1768, 2008. Return to text.
- Braun, E.L., Cracraft, J., and Houde., P., Resolving the avian tree of life from top to bottom: the promise and potential boundaries of the phylogenomic era; in: Kraus R.H.S. (Ed.), Avian Genomics in Ecology and Evolution, Springer Nature, Basel, Switzerland, 2019. Return to text.
- Burleigh, J.G., Kimball, R.T., and Braun, E.L., Building the avian tree of life using a large-scale, sparse supermatrix, Molecular Phylogenetics and Evolution 84:53–63, 2015. Return to text.
- O’Micks, J., Baraminology classification based on gene content similarity measurement, CRSQ 54:27–37, 2017. Return to text.
- Cserhati, M., Xiao, P., and Guda, C., K-mer based motif analysis in insect species across Anopheles, Drosophila and Glossina genera and its application to species classification, Computational and Mathematical Methods in Medicine, submitted, 2019. Return to text.
- Bulmer, R., The Uncleanness of the Birds of Leviticus and Deuteronomy, Man 24(2):304–321, new series, 1989. Return to text.
- Wenham, G.J., The Book of Leviticus, William B. Eerdmans, Grand Rapids, MI, pp. 174–175, 1979. Return to text.
- A heatmap represents the similarity between all possible species pairs. It visualizes the values of a sequence similarity matrix with light intensities, similar species pairs are represented by brighter colours, dissimilar ones by darker squares. Since the similarity matrix being represented is symmetric, the heatmap functions as a look-up table. The heatmap is created in such a way that it clusters species together which are all similar to one another. The similar species groups appear as smaller squares within the heatmap. Return to text.
- A beeswarm plot represents similarity values along a vertical axis. If there are a lot of values clustering around the same value, they are placed outwards, thus making the plot resemble a swarm of bees. The ECDF plot depicts the percentage of values on the y-axis that are less than or equal to a specific value on the x-axis. The greater the x value is, the greater the percentage of individual values less than that specific x value. Return to text.
- Lightner, J.K., An initial estimate of Ark kinds, ARJ 6:409–466, 2013. Return to text.
- Mahmood, M.T., McLenachan, P.A., Gibb, G.C., and Penny, D., Phylogenetic position of avian nocturnal and diurnal raptors, Genome Biol. Evol. 6(2):326–332, 2014. Return to text.
- Nesbitt, S.J., Ksepka, D.T., and Clarke, J.A., Podargiform affinities of the enigmatic Fluvioviridavis platyrhamphus and the early diversification of Strisores (‘Caprimulgiformes’ + Apodiformes), PLoS One 6(11):e26350, 2011. Return to text.
- Wink, M., El-Sayed, A-A., Sauer-Gürth, H., and Gonzalez, J., Molecular phylogeny of owls (Strigiformes) inferred from DNA sequences of the mitochondrial cytochrome b and the nuclear RAG-1 gene, ARDEA 97(4):581–591, 2009. Return to text.
- Jiang, L., Chen, J., Wang, P., Ren, Q., Yuan, J., Qian, C., et al., The mitochondrial genomes of Aquila fasciata and Buteo lagopus (Aves, Accipitriformes): sequence, structure and phylogenetic analyses, PLoS One 10(8):e0136297, 2015. Return to text.
- Larsen, C., Speed, M., Harvey, N., and Noyes, H.A., A molecular phylogeny of the nightjars (Aves: Caprimulgidae) suggests extensive conservation of primitive morphological traits across multiple lineages, Mol. Phylogenet. Evol. 42(3):789–96, 2007. Return to text.
- Holyoak, D.T., Nightjars and their Allies, Oxford University Press, Oxford, 2001. Return to text.
- Sibley, C.G. and Monroe, B.L., Distribution and Taxonomy of Birds of the World, Yale University Press, New Haven, CT, 1990. Return to text.
- Dumbacher, J.P., Pratt, T.K., and Fleischer, R.C., Phylogeny of the owlet-nightjars (Aves: Aegothelidae) based on mitochondrial DNA sequence, Mol. Phylogenet. Evol. 29(3):540–9, 2003. Return to text.
- Sangster, G., A name for the clade formed by owlet-nightjars, swifts and hummingbirds (Aves), Zootaxa 799:1–6, 2005. Return to text.
- Iwaniuk, A.N., Hurd, P.L., and Wylie, D.R., The comparative morphology of the cerebellum in caprimulgiform birds: evolutionary and functional implications, Brain. Behav Evol. 67(1):53–68, 2006. Return to text.
- A ‘BT plot’ shows the betweenness/total sum squared ratio for all values of k for the k-means clustering algorithm. Return to text.
- Robinson, D.A. and Cavanaugh, D.P., A quantitative approach to baraminology with examples from the primates, CRSQ 34:196–208, 1998. Return to text.
- Wood, T.C., BDIST software, v. 1.0, Center for Origins Research and Education, Bryan College, 2001. Return to text.


Readers’ comments
Comments are automatically closed 14 days after publication.