
Anthropogenic Global Warming (AGW)
—a biblical and scientific approach to climate change
Table of Contents
- The real history of the world from the Bible
- Is climate change just a matter of science?
- The science
- How scientific is ‘climate science’?
- The raw data
- The surface temperature record and CO2 rise
- The argument from consensus
- Scientists who disagree with the claimed consensus
- Predicting the future temperature is difficult
- What we need to know
- Does positive feedback (amplification) operate; that is, are the IPCC models realistic?
- Other factors causing climate change on planet Earth
- Data tampering (fraud?)
- Sea levels (tidal data)
- Coral reefs
- Ocean acidification
- Extreme weather events
- Other factors that should guide a Christian approach
Updated: 29 February 2024

Many Christians are asking CMI to comment on global warming (‘climate change’) said to be caused by human-generated carbon dioxide (CO2). This happens particularly at ministry events where we have a Q&A. It is certainly a ‘hot topic’, and many are confused because of the conflicting messages.
Until now, CMI has largely avoided the issue. For one thing, we don’t think of it as a core creation-Gospel issue. Also, some people get quite emotional about the subject, so it could be a risky thing to comment upon. No matter what view we take, some of our friends are going to disagree (and we understand). We always attempt to align our positions to a coherent Christian worldview based on God’s Word, but we don’t want to alienate people over tangential issues.
Also, scientifically, the issue is very complex, as I have found diving into the literature, and many colleagues, inside and outside CMI, have critiqued and contributed to what follows.1 Hence this document is a joint effort. It has come to over 14,000 words, and there are some mind-stretching concepts for those who are not scientifically trained (I’ve done my best to explain things, and there is a summary at the end).
The matter has certainly become a significant worldview issue, so we have decided that we should give some guidance. After all, we have considerable experience in Christian worldview matters, as well as collective expertise in the sciences that relate to climate and climate history.
Our Christian (biblical) worldview compels us to revere the God of creation. Some of the relevant principles are that:
- The universe and earth were created through and for Jesus Christ (John 1:3; Colossians 1:15–16).
- The earth was created for mankind (Genesis 1, 2; Isaiah 45:18).
- We are called to be holy and blameless in Jesus Christ (Ephesians 1:4; Genesis 1:31, 2).
- Christ holds His creation together (Colossians 1:17).
- Mankind is called to steward God’s creation (Genesis 1:27–29, 2:15, 9:1–7).
- We are to worship the Creator, not the creation (Romans 1:18ff), Gaia, or ‘Mother Earth’.
As Christians, we affirm that we have a responsibility to look after the environment (stewardship of God’s creation). That is a given; see: Fouling the nest. We are also compelled to consider the poor and the general welfare of our neighbours.
In the early days of ‘global warming’, many of CMI’s scientists were inclined to agree that CO2 from human activity could be causing significant warming of Earth (hence: anthropogenic global warming / AGW). Therefore, taking steps to moderate our contribution would be a good thing to do. However, we have become increasingly concerned with climate alarmism, which appears to be driven more by an anti-Christian worldview than scientific evidence. Here we share what has shaped our thinking from the Bible and from science.
1. The real history of the world from the Bible
We affirm the biblical time frame and the reality of the Flood. These provide a framework for thinking about the history of the climate as it relates to the current debate.
- According to the Bible (Genesis 1:27–29), people were commanded to fill the earth. Thus, God created Earth to be productive, to feed the people, and to be full of people. Of course, the Fall occurred when Adam sinned, causing the corruption of the creation (Genesis 3; Romans 8), and it would then have at times been difficult to get enough food to survive. Unfortunately, quite a few environmentalists are misanthropic (hating mankind) and have no interest in the needs of humanity, rather hoping for our demise. Of course, they rarely lead by example. This misanthropy comes through in several of the documentaries of the English nature TV presenter David Attenborough, calling us a “plague on the Earth”, for example.2
- In the biblical view, from the beginning humans were created to care for and rule over the earth (Genesis chapters 1 and 2) and everything in it. This is called the Dominion Mandate.3 In the modern secular view, based as it is on the narrative of deep-time evolution, humans are latecomers. Some then take the view that the environment worked perfectly well for hundreds of millions of years before humans arrived. Thus, they reason that if we get humans out of the equation the environment will function much better. In effect, that is what has been done in many parts of the world. In Australia, it was a major factor in the severity of the 2019 bushfires, due to the lack of fuel reduction and maintenance of firebreaks in the cool season.4 It has also led to desertification in national parks in Africa where grazing herds of cattle, managed by people for hundreds of years prior to that, were excluded.5
- Noah’s Flood, about 4,500 years ago, provides a mechanism for an ice age that followed it, in the northern hemisphere peaking after about 500 years and then declining rapidly for about 200 years (see The unique post-Flood Ice Age, by atmospheric scientist Michael Oard). Because the secularists “deliberately overlook” the Flood (2 Peter 3:5), they do not have a viable mechanism to explain an ice age. Slight variations in the earth’s orbit and axial tilt over long periods of time (the so-called Milankovitch mechanism) are said to create very slight differences in the amount of sunlight reaching the earth (or parts of the earth). However, these differences cannot create the massive changes in the temperature required to explain any ice age. Thus, secular scientists reason that the climate must be unstable. They then co-opted CO2 as a factor in amplifying the slight changes in sunlight. But that effect is not very large either, so positive feedbacks are invoked to amplify those effects to try to explain multiple ice ages. There is effectively no viable model for getting any ice age, but this belief in climate instability undergirds climate alarmism.
- Nearly all today’s coal was formed from vegetation buried during the Flood. The amount of vegetation suggests that the CO2 (‘plant food’) levels in the atmosphere between Creation and the Flood must have been very high compared to today’s levels. Even secular geologists agree that ancient (‘Palaeozoic’) CO2 levels were much higher, even 15 times more6). There is no evidence that Earth was cooked by this situation through a runaway ‘greenhouse’ effect.
- The much higher CO2 levels would enhance plant productivity enormously, allowing also for much more animal biomass. There is evidence, such as the amount of coal and other fossils, that Earth was prolifically productive pre-Flood.
- We have a biblical basis for our confidence that the climate is designed to be broadly stable. After the Flood, God promised: “While the earth remains, seedtime and harvest, cold and heat, summer and winter, day and night, shall not cease” (Genesis 8:22). This suggests that Earth would quickly recover from the catastrophic climate change that occurred with the Flood and the ensuing Ice Age. That is, Earth’s climate was designed neither to be chaotic nor prone to extreme changes. Imposed on an overall stable climate are smaller natural cycles. In such a situation we might expect times in the past where temperatures were similar to today. Indeed this is so. In the Roman Warm Period (RWP) from AD 1–400, temperatures were 2°C above the current temperatures for that region of the earth.7 The ‘Medieval Warm Period’ (MWP from AD 950–1300), also known as the ‘Medieval Climate Anomaly’ (MCA) was also warmer than now.8 Neither of these warm periods could have had anything to do with human-generated CO2. The RWP was a period of flourishing of the Roman empire. The MWP was a very productive time both for crops and the advance of science, logic, architecture, and the arts. On the other hand, the ‘Little Ice Age’ (AD 1300–1870) was a significant period of cold. The shorter crop-growing seasons caused famines, plagues, and widespread poverty.
- The Bible in many places records weather events that God ordained as judgment or blessing on people; that is, the weather is under God’s control.9 One well-known example is Joseph’s seven years of plenty and seven years of famine in Egypt, recorded in Genesis 41. Also, under the Mosaic Law, Israel’s idolatry invited crop failures (Leviticus 26; Deuteronomy 28).
Foundationally, the issue of climate change involves a deep-seated worldview conflict. As we said earlier, Christians should be concerned about ecology and we do have a duty to care for the environment. However, the fake, anti-Bible deep-time evolutionary history of planet Earth, based on naturalism (the belief that nature is all there is), feeds into a radical environmentalist ideology. This has now embraced climate change.
2. Is climate change just a matter of science?
Martyn Iles, head of the Australian Christian Lobby, says that we must ask what worldview drives the climate change agenda—where are these people coming from? Without a doubt the worldview driving the alarmism is not Christian; it is humanistic and neo-Marxist.10 It is a Babel mentality. People seem to think that they can be like God, even controlling the weather, as Jesus did when He stilled the storm on Lake Galilee.
On the other hand, if humans are contributing to environmental problems, we should address these issues proactively—as long as the cure isn’t worse than the disease. Indeed, many environmental problems of yesteryear have already been remedied in many countries (e.g., the handling of nuclear waste, cleaning up car exhausts, wanton dumping of toxic materials, etc.). However, problems still remain (e.g., microplastics and overfishing of critical stocks).
Statements by leaders of the climate change movement show that it has become a vehicle for globalization and wealth redistribution. For example:
The German economist and IPCC (Intergovernmental Panel on Climate Change) official Ottmar Edenhofer (that is, this is a mainstream view):
“But one must say clearly that we redistribute de facto the world’s wealth by climate policy. Obviously, the owners of coal and oil will not be enthusiastic about this. One has to free oneself from the illusion that international climate policy is environmental policy. This has almost nothing to do with environmental policy anymore, with problems such as deforestation or the ozone hole.” (said in 201011)
For a non-mainstream view, we have Extinction Rebellion (XR) co-founder, Stuart Basden (2019):
“And I’m here to say that XR isn’t about the climate. You see, the climate’s breakdown is a symptom of a toxic system that has infected the ways we relate to each other as humans and to all life.”
He goes on to use neo-Marxist rhetoric criticising “heteronormativity”, “patriarchy”, “white supremacy”, and “class hierarchy”. He says XR is about fixing the system; that is, destroying Western society.12
Furthermore, there is an inconsistency between the ‘walk’ and the ‘talk’ about a ‘global’ concern. If the concern was truly about saving the planet from global warming due to human-generated CO2, surely the greatest sources of the CO2 should be the main target for the action? Then why, when China is the world’s largest CO2 producer, is no one protesting outside Chinese embassies? Australia (for example) contributes just 1.2% of the world’s emissions, and yet is a target for activism. Yet if its emissions disappeared completely (with Australia reduced to a pre-industrial age), it would not make a detectable difference in world CO2 levels.
As of 2018, for example, China had nearly a thousand gigawatts (GW) of coal-fired electricity generation, compared to 261 GW for the USA and just 36 GW for Australia.13 Moreover, neither China nor India have any target to reduce their total CO2 emissions under the Paris Accord. Hundreds of new coal-fired power stations are planned for China, India, and other places. Where are the protests about China and India ‘destroying the planet’? The moral imperative should surely be to go after the biggest contributors first.
Someone might protest that Australia’s per capita emissions are greater than for China and India, and therefore the moral imperative is for Australia (or insert another small Western country) to take drastic action. But other than for virtue signalling, this is irrelevant to the health of the planet (given that AGW is going to destroy the planet). The planet cares not about per capita emissions; the only thing that matters is the total emissions.
And while the USA was lambasted for pulling out of the Paris Accord, it has actually cut CO2 emissions thanks to it turning to natural gas.14 Natural gas is a low CO2-emitting fuel and enables the very efficient combined-power-cycle electric generation. Conversely, most countries staying in the Paris Accord have failed to meet their targets.15
Furthermore, if climate change activists were really concerned about saving the planet from the effects of human-produced carbon dioxide, why are they not generally supporting nuclear power? Ever since its first report in 1990, the IPCC has proposed that nuclear power has a major role to play in replacing fossil fuel power generation, but the activists don’t seem too keen. Nuclear energy now provides about 10% of the world’s electricity from about 440 reactors.16 And because of its high energy density, it’s also very ‘green’—if this energy were produced by fossil fuels, it would emit two billion tons of CO2 per year. Nuclear power gives France the cleanest air of any industrialized country, and the cheapest electricity in Europe. It exports some to its neighbours.17
While many people have genuine environmental concerns, the radical, activist leaders apparently want to undermine the economies of the West, not save the planet. However, to further their true agenda, they need to recruit lots of people who will support radical changes to ‘save the planet’. In so doing, many innocent people, particularly naïve young people, including Christians, are getting caught up in what is ultimately a very destructive agenda.
The fruit
Jesus said, “By their fruit you shall know them” (Matt. 7:16). He was speaking of spiritual/moral fruit (righteousness vs. unrighteousness), but the principle applies more generally, and there is certainly an unrighteousness about a movement that is intent on destroying the material means for human flourishing.
Failed predictions are a major fruit of climate activism, justifying skepticism.
- Anyone who remembers the 1970s will recall that we were all going to freeze in another ice age. Of course, ‘we’ could do nothing about that, so some of the same ‘experts’ who were running with that switched to ‘global warming’ and then, when the temperature data did not match the models that gave the dire predictions, it morphed into ‘climate change’. Also popular were ‘acid rain’ and the ‘ozone hole’.
- In 1989 the UN said, “Entire nations will be wiped out by the year 2000 if sea level rises are not stopped.” Did this happen? No! Tuvalu, a Pacific Ocean nation of atoll islands, is a favourite poster child for this claim. However, Tuvalu has increased 3% in land area over the last 40 years.18 A survey published in 2018 of 30 Pacific and Indian Ocean atolls, including 709 islands, revealed that no atoll had lost land area in recent decades.18
- In 2007, Dr Tim Flannery, an evolutionary mammologist who headed up the Australian government’s climate change unit, predicted that even the rain that would fall would not be enough to fill the reservoirs. Australia has had major floods since then.
- Flannery also said in 2008, “Just imagine yourself in a world five years from now [2013], when there is no more ice over the Arctic.” Similarly, in 2008 Al Gore said that the polar ice would be gone by the summer of 2014. They were echoing the common view of ‘mainstream’ climate scientists (e.g. James Hansen, Peter Wadhams, and others, widely reported in media outlets). The Arctic sea ice area measured each September (the end of summer, its lowest extent of the year) declined from about 7.5 million km₂ in 1980 to about 4–5.5 million km₂ from 2010–2020 (NSIDC/NASA)—which is still a lot of ice, so the predictions of no ice were seriously out of touch with reality. Please note that fluctuations in the amount of Arctic ice are expected. Besides short-term variation, there could be long-term trends as well. But this cannot be divorced from a discussion of the Ice Age caused by the Genesis Flood.
- Polar bear numbers, it was predicted, would decline, and were even threatened with extinction due to a shrinking area of Arctic sea ice. Such dire predictions were used by Al Gore, Michael Mann, and others to play on the emotions of the public to support radical action on climate change. Mann even published a children’s book in 2018 using polar bears to capture the imaginations of children. Since 2005, the global polar bear population has increased.19 Even so, we wonder why a typical evolutionist would be at all concerned. If polar bears go extinct, so what? Something else will evolve to fill their place, or not, but it does not matter either way if life on earth is nothing more than a cosmic accident. The fact that they are trying to make emotional moral arguments when they have no basis for doing so only shows that this is more about manipulation of public opinion than about science.
There are many other failed predictions (mass extinctions, increasing droughts, decreased food production, increasing frequency and intensity of cyclones/hurricanes and typhoons, increasing number and intensity of tornados, decreasing snowfall, etc.).20 Few, if any, are based on any objective science.
It seems like every major weather-related event gets co-opted by climate change activists. They called the 2019 bushfires in Australia “unprecedented” and attributed them to climate change. They were most definitely not ‘unprecedented’ in terms of either lives lost or area burnt. For example, in the 1938–39 fire season, over 80 lives were lost in bushfires in Victoria and NSW, compared to 34 in the recent fires. And the 5 million hectares burnt compares with 117 million hectares in the fires of 1974–75.
The most relevant failed predictions of the climate alarmists are those regarding rising global temperature, from the climate models (next).
3. The science
How scientific is ‘climate science’?
Before discussing some specifics regarding the science of climate change, let us consider how science works and how this impacts the science of climate change.
- “A basic tenet of science is that you can do repeatable experiments.”21 The heart of the scientific method is that hypotheses can be tested with experiments. Repeated measurements of the response to a treatment allow the calculation of a confidence in the conclusion about the effect of that treatment being true, and not just due to some random variation. A probability of 95% is normally the lowest accepted in science (i.e. 1 experiment in 20 will give a false result). In climate science, the observed phenomenon is that the global surface temperature has been increasing, as has the CO2 in the atmosphere. The hypothesis is that the temperature increase is caused by the CO2 that is being released into the atmosphere by human activity. However, it is not possible to design a repeatable experiment to test this hypothesis because of the size, complexity, and uniqueness of the ‘system’ (there is only one planet Earth and it is rather complicated). Consequently, we are left with conjectures and predictions. Applying statistical models (such as ARIMA or Hurst–Kolmogorov) to the past temperature data can generate a prediction for the future, but the confidence limits (95%) are so wide that the predictions are useless. And this approach cannot say that CO2 is causing the change. Thus, the climate models that predict a temperature response to CO2 have to be deterministic; that is, they assume that the inputs will determine the temperature. Hence the assertion based on these models that CO2 causes global warming is circular reasoning. Worse, even as recently as a decade ago climate models could not deal with factors like cloud cover. Computers are getting faster, and climate models are getting more sophisticated, but significant areas of the climate are still beyond our modelling reach.
- Science cannot prove theories to be true; only that they are false.22 Observing a result that is predicted by a hypothesis does not prove that the hypothesis is true (this is the fallacy of affirming the consequent). These same results might also be consistent with some other hypothesis. On the other hand, we can show a hypothesis to be false by finding evidence that contradicts it. Biblical creationists will be familiar with this truth since the evidence said to prove evolution (e.g. mutations, natural selection, speciation) is perfectly consistent with creation. Thus, while the existence of observations that are consistent with theoretical predictions is necessary for the survival of any theory, data that are inconsistent with these predictions are more important. Such data tell us that the hypothesis is incorrect. If there are no contrary data, despite myriad repeated experiments to test the hypothesis, as is the case with, say, the First and Second Laws of Thermodynamics, the theory is most probably valid. If the climate models used to predict the future temperature based on carbon dioxide levels fail to predict those temperatures, the models must be rejected or modified.
- Correlation does not mean causation: That the temperature has been increasing along with the level of CO2 does not mean that one caused the other. For example, between June and December of 2008 both the temperature in Calgary AB Canada and the Toronto Stock Exchange Index decreased dramatically. However, one did not cause the other. Thus, the observation that the atmospheric temperature and CO2 concentration are both increasing does not mean that one is causing the other—either one may, indeed, be causing the other, or both could be being caused by something else, or they could be completely unrelated.
- Science is often captured by a ‘ruling paradigm’: A paradigm is a framework used by default for the interpretation of data. It is just assumed to be true. Sometimes this is done explicitly when scientists do not have a better idea and so they just run with the best idea they have, anticipating that they could be wrong. At other times, the ruling paradigm is subliminal or is being hidden by certain players in the game. In the latter cases, data that are inconsistent with the paradigm are treated as errors by the researcher or dismissed because the researcher is judged not to have appropriate credentials, unacceptable political leanings, any sort of religious beliefs, or funding sources deemed inappropriate. Or, if none of these applies, the errors are accommodated within the ruling paradigm by introducing ancillary hypotheses. The Ptolemaic geostationary model of the solar system is a well-known (false) paradigm that ruled the interpretation of astronomical observations for about 1,500 years. The big bang and biological evolution are two modern ruling paradigms in cosmology and biology/paleontology respectively. Thus, it should not surprise us that climate science has been captured by the ruling paradigm that anthropogenic CO2 will cause catastrophic climate change. Nothing else is considered.
- Peer-review does not ensure truth: Peer review, especially when coupled with publication in ‘prestigious’ scientific journals, has come to be taken as the ‘gold standard’ of science. And the contents of scientific papers are often treated as beyond question. There are numerous examples of failure in the peer review process. A prominent incident prompted one academic to write a scathing critique of peer review that was published in The Guardian:23 “At its worst, it [peer review] is merely window dressing that gives the unwarranted appearance of authority, a cursory process which confers no real value, enforces orthodoxy, and overlooks both obvious analytical problems and outright fraud entirely.” The Climategate emails (see later) showed that this problem afflicts climate science.
Let us now test some of the major predictions in climate science.
The raw data
Let us recognize two facts:
- Atmospheric CO2 has increased since 1860 from about 285 ppm (parts-per-million; 0.029%) to 410 ppm (0.041%) in 2020. This amounts to about a 50% rise over 160 years. The current rate of increase is about 2 ppm per year.
- The planet has warmed by about 0.8°C since 188024 and half of this warming occurred before there was any significant change in the CO225(that is, this part of the warming could not be due to human activity).
The debate is mainly over the role of humans in global warming; is human-generated CO2 contributing to the warming? If it is, how much of the warming is due to human activity? And will the warming be enough to be of concern? Further, are the proposed means to counteract this going to do more harm than good?
Note that the human contribution to CO2 emissions through the burning of fossil fuels and cement production is not the only contributor to atmospheric carbon. Other sources include changes in land use (e.g. deforestation), volcanoes, the weathering of rocks, the release of carbon dioxide from the oceans (any warming of the oceans results in CO2 being less soluble and therefore it is released into the atmosphere), the breakdown of organic remains (dead wood in forests), etc.26
Greenhouse gases (GHGs) are especially important for the liveability of planet Earth. Without them, the average temperature would be ~33°C lower; in other words, we would be well and truly frozen! (The average global temperature is 14.5–15°C.) Nearly all of this GHG effect is due to water vapour, and only about 3.3°C is due to CO2.27 The atmosphere is mostly nitrogen and oxygen, which have no greenhouse effect. Many discussions of climate change have excluded the effects of water vapour, which should respond dynamically to changes in temperature. Yet, since water has a much greater greenhouse effect, the exclusion of water from the debate is inexcusable. Other significant GHGs include methane, nitrous oxide, and chloro-fluorocarbons (CFCs), which were popular refrigerants in the past that have been removed from the equation.
The surface temperature record and CO2 rise
Notwithstanding the problematic nature of the surface temperature record (see later: Data tampering (fraud?)), is it consistent with human-generated CO2 being the cause of a rise in temperature?
The amount of anthropogenic CO2 has risen fairly consistently since 1880, but the global temperature has not; there have been periods of warming and cooling (see Fig. 1).

A prominent member of the climate establishment, Dr Phil Jones, admitted that the rates of global warming from 1860–1880, 1910–1940, and 1975–1998 (the red lines in Fig. 1) “are similar and not statistically significantly different from each other”.28 However, the amounts of human-generated CO2 at those times (green line in Fig. 1) are very different. Indeed, the rate of rise in temperature 1860–1880 is similar to the recent rise, and yet the amount of human-generated CO2 is about 60 times greater for the latter period. And there have also been significant periods of cooling (1880–1910 and 1940–1950) and while CO2 emissions were rising. These data show that the global temperature is not rising consistently with the increased production of human-generated CO2. Note that the chart shows human-generated CO2, not total atmospheric CO2, which has risen less than 50% since pre-industrial times. These observations cast doubt on the claim that human-generated CO2 is the prime cause of periods of global warming since 1880.
The argument from consensus
The claim that 97% of scientists agree that human-generated CO2 will cause catastrophic warming to planet earth is fake news. Even if it were accurate, it would not prove that it is correct. It is the fallacious ‘argument from consensus’. As Michael Crichton said, “Consensus is the business of politics. If it’s consensus, it isn’t science. If it’s science, it isn’t consensus. Period.”
This argument has strong parallels to a major argument for evolution, that because most scientists accept it then it must be true, which of course evolution is not, as a growing wealth of evidence from modern science shows.
In the USA, the Global Warming Petition Project has garnered the signatures of some 31,500 scientists resident in the USA alone, including over 9,000 with PhDs, who dispute the claim that CO2 will cause serious problems.29 This alone casts serious doubt on the 97% figure.
The justification for ‘97%’ has been a 2013 paper that, based on the abstracts of nearly 12,000 climate science papers published from 1991 to 2011, concluded that 97% of those who expressed an opinion endorsed the consensus view that “humans are causing global warming”.30 Based on this, former President Obama’s twitter account declared, “Ninety seven percent of scientists agree: climate change is real, man-made and dangerous.” Note how the paper’s claim morphed from humans are causing some global warming into all climate change is man-made and dangerous. This is deceitful (an activist group called Organising for Action posted the Tweet).
Moreover, the study was conducted by members of another activist group, Skeptical Science, which exists to promote public acceptance of AGW. When the raw data are examined, according to the authors’ own ratings, only 64 of the nearly 12,000 papers actually claimed that most of the warming is caused by human activity. In a follow-up analysis of the same papers, other researchers found that only 41 of those 64 papers endorsed the position that most of global warming was man-made.31 Taking into consideration that ⅔ of the papers expressed no view, that amounts to less than 1% of the papers that expressed a view. How did the authors get their 97%? They amalgamated all views that human-generated greenhouse gases are causing some warming. However, even most skeptics of the alarmism, including many who signed the Global Warming Petition (above) agree that human-generated CO2 causes some warming. This is a trivial finding.
The survey did not address the question of climate change being ‘dangerous’ or a ‘crisis’ or anything like that. Such claims are made by politicians and actors-cum-activists.
So, the 97% figure is a dishonest twisting of statistics, and the activists’ own raw data show that very few scientists agree even that most of the warming is due to human activity, let alone that it is dangerous.32
Scientists who disagree with the claimed consensus
In 2016 alone, over 500 papers were published in peer-reviewed science journals that seriously questioned the supposed ‘consensus’ on climate change.33
Some high-profile scientists who dispute the alarmism include:34
- Lennart O. Bengtsson, who was Director of the Max Planck Institute for Meteorology in Hamburg, Germany.
- John R. Christy, Distinguished Professor of Atmospheric Science and Director of the Earth System Science Center at the University of Alabama in Huntsville.
- Roy Spencer, University of Alabama in Huntsville, and NASA. He and Dr John Christy received NASA’s Exceptional Scientific Achievement Medal for their global temperature monitoring work with satellites.35
- Judith A. Curry, who due to the “craziness” of the politicization of climate science, in 2017 took early retirement from her position as Professor in the School of Earth and Atmospheric Sciences at Georgia Tech, USA, a position she had held for 15 years.
- Richard S. Lindzen, Professor Emeritus in the Department of Earth, Atmospheric and Planetary Sciences at MIT, contributed to the IPCC’s 1995 and 2001 reports, but became skeptical of the alarmist climate model projections.
Nir J. Shaviv, Professor and Chair of the Racah Institute of Physics at the Hebrew University of Jerusalem.
There are many others. In September 2019, a global network of 500 prominent climate scientists and professionals stated that there is no ‘climate emergency’. They invited the UN to organize with them a constructive high-level meeting between world-class scientists on both sides of the climate debate early in 2020.36 As at 27 April 2022, over 1,000 have now signed the declaration.
When we consider the persecution that dissenters have experienced (e.g. Dr Judith Curry mentioned above), we see another parallel to the creation/evolution debate. In both cases, dissenters from both the Darwinian and climate-alarmism paradigms have been demoted and even fired.37,38
The consensus argument is little more than a bullying campaign intended to stifle dissent and debate, as it is with the creation/evolution debate.39
Predicting the future temperature is difficult
The UN’s IPCC stated in 2001 that: “The climate system is a coupled non-linear chaotic system, and therefore the long-term prediction of future climate states is not possible.”40 Nevertheless, that is exactly what they did, predict the future temperature! But because it is so complex, over 100 different models have been used—if it were clear cut (simple), or ‘settled’ there would be one model.
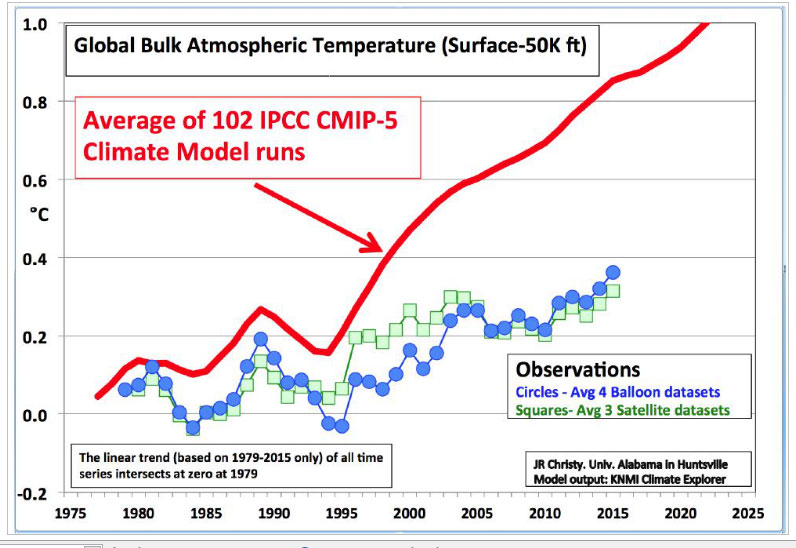
A major test of any scientific mathematical model is the accuracy of predictions. It is now clear that the climate models used by the UN’s IPCC to garner world action to cut CO2 emissions in wealthy countries (i.e. transfer wealth, as above) have failed badly. Nearly all the models seriously over-predict global surface temperature response to rising CO2—see Figure 2. The fact that recent temperature measurements have diverged from nearly all climate models, on the low side, is a serious blow to all the modelling efforts. The models are simply wrong. Thus, the dire predictions about a coming global temperature crisis are also wrong.

What we need to know
We need to know how much Earth will warm in response to an increase in CO2. The ‘Equilibrium Climate Sensitivity’ (ECS) is the amount of warming expected from a doubling of the CO2 level. If this is unacceptably high, then an appropriate response might be to take steps to reduce human-generated CO2 emissions. If the ECS is acceptably small, then there is little point in acting to limit emissions.
The direct greenhouse effect of CO2 is generally agreed upon, at about 1.1°C increase for a doubling of the atmospheric CO2 concentration. Some even argue for a figure of 0.5°C (see later).
Importantly, this is not a linear relationship. There is a diminishing effect of adding more CO2 because it absorbs only certain infrared frequencies and most of those are already absorbed. In other words, climate sensitivity decreases as the CO2 concentration increases. Van Wijngaarden and Happer show this, based on the infrared (‘heat’) spectral absorption curve for CO2.41 This is not conjecture, but solid experimental physics and shows that 400 ppm CO2 contributes 30 W/m2 reduction in thermal radiation into space from Earth. Increasing the CO2 to 800 ppm contributes only a further 3 W/m2. In other words, 90% of the greenhouse effect of CO2 up to 800 ppm is already done at 400 ppm (approximately the current atmospheric concentration). The direct effect of such a doubling would be only a 0.6°C rise in Earth’s temperature (but see later about feedbacks). The IPCC in their 2001 report42 gave some acknowledgement to this decreasing effect, but their ‘forcing’ from doubling from 400 to 800 was around 4.5-5 W/m2, depending on the various formulas used, which is up to 50% more than the 3 W/m2 figure based on the spectral absorption curves. But even with this, the direct effect on Earth’s temperature would be only about 0.9°C.
Furthermore, even assuming that all of the 2 ppm per year increase in CO2 is due to human activity, it would take nearly 200 years to double the atmospheric CO2 level to 800 ppm!
Why the panic? It comes partly from the IPCC’s climate models that add positive feedback, or amplification, to the ~1 degree of warming expected from CO2 alone (without considering any secondary, or knock-on effects). Thus, the IPCC AR5 (2013) placed the ECS at between 1.5 and 4.5°C. The report acknowledged, “No best estimate for equilibrium climate sensitivity can now be given because of a lack of agreement on values across assessed lines of evidence and studies” (p. 16).
The IPCC AR6 (2021) now gives a best estimate of 3°C for climate sensitivity. Interestingly, the report reduces the range of likely temperatures for a doubling of the CO2. The extreme high has been reduced to 4, and the lower bound increased to 2.5.
The greatest disagreements among climate scientists are over how much positive feedback they expect—i.e. will the direct warming effect of increased CO2 be amplified by increased water vapour in the atmosphere due to the warming of the oceans? This extra water vapour would trap more of the incoming radiation and thus amplify the warming from CO2. The models that the IPCC relies upon all incorporate substantial positive feedbacks.
Does positive feedback (amplification) operate; that is, are the IPCC models realistic?
Dr David Evans formerly advised the Australian Federal government’s Greenhouse Office (now the Department of Climate Change), from 1999 to 2005, and part time from 2008 to 2010. He has six degrees related to modelling and applied mathematics, including a PhD from Stanford University. He resigned because he no longer believed that human-generated CO2 would cause a damaging temperature increase; he changed from being a ‘warmist’ to a skeptic because of the scientific evidence. He has put together a strong scientific case.43 He tests the predictions of the models—as explained above, any failures in such predictions show that the models are faulty and should be rejected. Evans does not argue from deep-time history, but from current measurements that test the predictions of the models.
Evans used four unbiased sources of data: 1) NASA satellite global air temperatures; 2) over 3,000 Argo buoys that constantly patrol the oceans of the world measuring the temperature profile of the oceans; 3) weather balloons, which have measured the temperature profile of the atmosphere since the 1960s; 4) outgoing radiation from the planet as measured by satellites.
Summary:
- Dr James Hansen, the ‘father of global warming’, presented temperature predictions to the US Congress in 1988. His model predicted considerably higher air temperatures than revealed by NASA’s subsequent satellite data, which show little change over the next 18 years, even though CO2 increased in that period. Furthermore, even where a radical reduction in CO2 emissions was assumed, with no increase in atmospheric CO2 after the year 2000, the model predictions exceeded the actual temperatures that occurred with continued CO2 production. That is, the model predicted quite excessive temperatures. Failure 1.
- The UN’s IPCC models, published in 1990. Again, compared to NASA’s satellite-measured air temperatures, even the lowest temperatures predicted exceeded reality (see Figure 2). Failure 2.
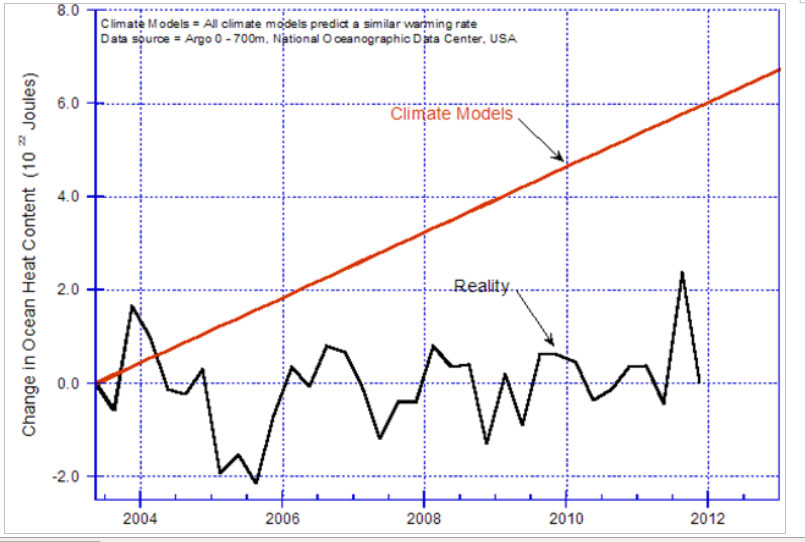
- Argo ocean temperatures from 2003. There is almost no change in the global ocean heat content from this unbiased data set. Why do we seldom hear of these data? The IPCC models greatly over-predict the heat content (temperature profile) of the oceans compared to these data (see Figure 3). Failure 3.
- The positive feedback in the IPCC models that amplifies the CO2 effect is claimed to be largely due to water vapour. If this were the case, there should be an atmospheric hot spot in the middle altitudes (the mid-troposphere) at the tropics. Both the global balloon data and the satellite data show no such hot spot in the atmosphere (see Figure 4), which means that positive feedback is not operating, contrary to the models’ predictions. Failure 4.
- The IPCC models include positive feedback from increased water vapour due to the warming of the oceans. This extra water vapour is supposed to trap more of the incoming radiation and thus amplify the warming. Thus, as the sea surface temperature increases, there should be more water vapour and then less outgoing radiation from the earth. However, satellite measurements show increased outgoing radiation, the opposite of IPCC models’ predictions. As the climate scientists Lindzen and Choi said, “The results imply that the models are exaggerating climate sensitivity.”45 Failure 5.
Table 1. A summary of how the climate models have failed every test (from Evans, The skeptics case45)
| Test | Climate models |
| Air temperatures from 1988 | Over-estimated rise, even if drastic cut in anthropogenic CO2 |
| Air temperatures from 1990 | Over-estimated trend rise |
| Ocean temperatures from 2003 | Greatly over-estimated trend rise |
| Atmospheric hotspot | Missing (water vapour feedback not amplifying) |
| Outgoing radiation | Opposite to reality (water vapour feedback not amplifying) |
The last two points (d, e) mean that the positive feedbacks (amplifications) which are so critical to all the IPCC’s models do not operate. That is, the maximum climate sensitivity (ECS) is 1.1°C (this, remember, is the amount of warming expected from a doubling of the level of CO2).
However, the last point provides strong evidence of negative feedback, which would reduce the ECS to less than 1.1°C. This negative feedback is probably due to enhanced cloud cover with an increase in temperature. We all experience this; in cloudy weather, the temperature during the daytime is lower due to the cloud reflecting the sun’s radiation back into space. Clouds also maintain warmer night-time temperatures. This shows that in the daytime the reflective effect of the cloud (the albedo) greatly exceeds the greenhouse effect.
The negative feedback means that the ‘climate sensitivity’, the effect of doubling atmospheric CO2 on global temperature, falls to about 0.5°C. It would be hard to argue that this would be anything but beneficial for the planet (see also later section: CO2 is ‘plant food’).
Nevertheless, the feedbacks remain uncertain. An independent comprehensive study from the Helmut-Schmidt-University, Germany, arrived at an ECS of 0.7°C and also concluded that negative feedbacks more than offset positive feedbacks, and also that the sun contributed 60% of the recent warming.46
Using a somewhat different approach, other researchers found the median (most likely) value of the ECS to be 1.5°C, at the bottom of the range published in the Fifth report (AR5) of the IPCC,47, although outside the bottom bound of the Sixth report of the IPCC (2022) of 2.5°C.
Note added May 2022: A study published in 2021 used gaseous absorption spectra throughout the atmosphere to calculate from first principles (not an atmospheric circulation modelling approach) the ECS. The researchers determined a value of 0.5°C, including the positive feedback from water vapour. They also showed that the contributions from doubling methane and nitrous oxide were insignificant (each less than 0.1°C). See endnote #27.
Note added December 2023: Roy Spencer and John Christie have published a model of global warming based on recent heat balance data for the land and oceans.1 Heat balance is a fail for the IPCC’s favoured general circulation models that are at the core of all its forecasts—if the models were realistic, they should match the heat balance observed. Assuming that all warming is due to the CO2 increase, Spencer and Christie arrived at an ECS of 1.9 degrees C. Even with this assumption, this is well below the most recent IPCC minimum ECS of 2.5 degrees C. If 60% of warming is due to the sun (see above), this would bring the ECS back to well under 1 degree C.
[1] Spencer, R.W. and Christy, J.R., Effective climate sensitivity distributions from a 1D model of global ocean and land temperature trends, 1970–2021. Theor. Appl. Climatol., 2023; https://doi.org/10.1007/s00704-023-04634-7Our opinion is that these sorts of values for the ECS are nothing to panic about. And the IPCC would seem to tacitly agree, because their target (based on the faulty models) is to limit the warming to 1.5°C. The bottom line is that we don’t have to take any drastic action to limit the warming due to human-generated CO2 to less than 1.5 degrees C.
Indeed, life on earth flourished in the past when things were warmer (e.g. during the Medieval Warm Period when the temperature was about 1°C warmer than now, based on several lines of evidence). On the other hand, times of coolness (like The Little Ice Age) caused widespread poverty.
It would be helpful if climate science could progress in this area to give us more certainty, and it is a shame that politics is interfering and thus impeding progress.
Other factors causing climate change on planet Earth
A study published in 2020 attributed a substantial amount of the warming in the Arctic to the rise in ozone-depleting substances in the second half of the 20th century. Such substances, such as chloro-fluorocarbons, or CFCs, are powerful greenhouse gases. The authors wrote, “Gases that deplete the ozone layer could be responsible for up to half of the effects of climate change observed in the Arctic from 1955 to 2005.”48 Also, a reduction in the area of snow or its annual duration results in less reflection of sunlight back into space, and therefore more Arctic warming due to this, irrespective of overall global climate change. This would be an ongoing effect of the earlier warming due to the CFCs.
Note added 26 November 2021: A major study of the temperature of the Arctic Ocean over the last 800 years, using various proxies for temperature from sea-floor sediments, found that a jump in warming began around 1900, along with rapid sea ice retreat (Science Advances 7(48), 24 Nov 2021, science.org/doi/10.1126/sciadv.abj2946). This is well before any significant rise in human-generated CO2 (Figure 1). The study attributed the warming to the increased penetration of the northward current from the Atlantic, but it is quite a complex situation. Again, this cannot be explained by anthropogenic global warming. The authors acknowledge, “Currently, the latest CMIP6 historical climate experiments … fail to reproduce the post-LIA [Little Ice Age] Atlantification documented in our reconstructions.”
The sun
The sun is, rather obviously, a major driver of climate on Earth. Solar cycles affect the climate via stratospheric warming, cosmic rays, and cloud cover, and there are cyclical movements of Earth’s position relative to the sun. The 11-year solar cycle is evident in a cyclical variation in Earth’s temperature of the order of 0.2 degrees C,49 but longer-term cycles are harder to study.
The ‘Maunder Minimum’ was a prolonged period of very low sunspot numbers from 1645 to 1715, during ‘The Little Ice Age’, when it was very cold (with crop failures). We have recently moved into an exceptionally quiet period of solar activity. For the first time since the 1600s we have had several recent years with no sunspots. Maybe the normal 11-year cycle will resume, but maybe not. If the primary driver of the climate is the sun, and if we cannot yet predict what it will do on a short timeframe, how can we predict temperatures decades and centuries out?
In the 1990s, Danish physicist Henrik Svensmark and colleagues began publishing on the effect of cosmic rays on cloud formation, which would affect global warming/cooling.50 They demonstrated that ionising radiation causes nucleation sites to form, around which water droplets form, leading to cloud formation. The hypothesis is that when the sun’s solar wind is strong and Earth is protected from cosmic rays, there is less cloud formation and the earth warms. Conversely, when the solar wind is weak (i.e. when sunspot activity is at a minimum), more cosmic rays enter Earth’s atmosphere and more clouds form, cooling the planet.
Dr Brian Tinsley, professor emeritus at the University of Texas, Dallas, proposed an alternative model wherein cosmic rays make clouds last longer, thus cooling the earth. This seems to explain a wider range of observations than Svensmark’s model.51
Air pollution reduction
North America, Europe, and increasingly Asia, have made good progress in reducing air pollution since 2000. Aerosol pollutants exert a cooling effect. The reduction in such pollution has been calculated to contribute +0.5°C to global temperatures (Quaas, J., et al., Robust evidence for reversal of the trend in aerosol effective climate forcing, Atmos. Chem. Phys. 22:12221–39, 2022 | doi.org/10.5194/acp-22-12221-2022). Obviously, this has been a significant contributor to recent global warming.
In 2020, the International Maritime Organisation (IMO) promulgated a regulation that ships’ exhausts must reduce sulfur emissions from 3.5% down to 0.5%. This would have the effect of reducing nucleation sites for cloud formation, resulting in less cloud, which means less reflection of sunlight and greater warming of the oceans. This may have contributed to the recent rise in sea surface temperatures.
These important areas of climate science tend to get insufficient attention due to the excessive focus on CO2 as a driver of climate change.
Data tampering (fraud?)
- “Test everything; hold fast what is good.” (1 Thessalonians 5:21)
The satellite data (Figure 2) show some global warming since 1980, but we need the land-based observations before that to determine if the recent temperatures are unusual.
Dr Evans (above) only used the satellite data that had not been subject to tampering in his evaluation of the climate models. There is good reason for this, as there is strong evidence that institutions such as the CRU of the University of East Anglia, NASA and NOAA in the USA, the UK climate authorities, and the Australian Bureau of Meteorology (BOM) have been adjusting historical terrestrial temperature records to support the case for CO2-driven global warming.
The now-infamous ‘hockey stick’ graph (Figure 5) produced by Michael Mann (Penn State University) and co-authors was the lynchpin of the AGW movement. The IPCC used the graph in the Summary for Policy Makers in their Third Assessment Report (2001). It was very influential. The graph was exposed as deceptive; it ‘erased’ the Medieval Warm Period from the temperature record, and worse.52 Mann even sued a critic, lost, and then refused to pay the court-ordered costs. Underlining how corrupt climate science has become, instead of being disgraced, Mann was awarded the 2019 Tyler Prize for Environmental Achievement!

The extent of the mischaracterisation of the data (Fig. 5) has been thoroughly exposed (see: by McIntyre, S. and McKitrick, R., Corrections to the Mann et. al. (1998) proxy data base and northern hemispheric average temperature series, Energy & Environment 14(6):751–771, 2003; DOI: http://dx.doi.org/10.1260/095830503322793632). McIntyre and McKitrick concluded, “the dataset used to make this construction contained collation errors, unjustified truncation or extrapolation of source data, obsolete data, incorrect principal component calculations, geographical mislocations and other serious defects. These errors and defects substantially affect the temperature index.” After correcting the errors, using the same data set, the reviewers “yielded a Northern Hemisphere temperature index in which the late 20th century is unexceptional compared to the preceding centuries, displaying neither unusually high mean values nor variability.” See Figure 5a.

Mann’s massaging of the data might be the tip of the iceberg globally. Other inappropriate data manipulation has been proven.
Dr Jennifer Marohasy54 demonstrates this for Australia’s Bureau of Meteorology (BOM). The BOM has had two goes at adjusting the historical temperature record for Australia, dubbed Acorn1 and Acorn2. Acorn1 adjustments apparently did not produce enough warming, so they increased the recent warming with Acorn2! They did this by reducing earlier recorded temperatures and increasing recently recorded temperatures. They claimed that this was necessary because of changes in equipment and situations of the weather stations, and that they were following ‘world’s best practice’, without stating just what that meant. Changes in weather stations include:

- Using electronic temperature sensors, which have short lag-times compared to a traditional mercury bulb thermometer.
- Use of small plastic temperature screens, instead of the formerly-standard Stevenson screen—the white, wooden, double-louvred box that is used to shelter the temperature sensors from direct or reflected radiation from the sun so that shade temperature is measured.
- The situation of the equipment, such as urbanisation causing a heat island effect.
Automatic weather stations with electronic sensors and small plastic screens have been increasingly adopted into weather data networks since about 1980.
Note that all the above changes would inflate recent temperatures. So any adjustments to make them comparable with earlier recordings should be to reduce them, not increase them!55 Furthermore, there are proven instances of the deletion of high temperatures from the past records—such as Australia’s hottest day on record, being 125°F (51.7°C) at Bourke on 3 January 1909. BOM claimed that it was anomalous because the nearest stations failed to record a similar temperature. However, nearby Brewarrina recorded 123°F (50.6°C) for the same day. Furthermore, the second hottest on record, 124°F (51.1°C), recorded at White Cliffs on 12th January 1939, is also not included in the official digitized records (the late ‘30s was a hot period in the USA also; see Figure 6).56
Such claims as the ‘hottest year on record’ (etc.) that are periodically released to the media are based on these ‘adjusted’ historical data sets.
NOAA and NASA in the USA have been doing similarly. Two graphs illustrate some of the data manipulation that has been going on (compare Figure 6 and Figure 7).


The spike in the 1930s (circled) was adjusted down while the spike in the late 1990s (circled) was adjusted up, along with the other temperatures, making it look like recent temperatures were unusually high when they were not at all. NASA/GISS claim that changes in the time at which the daily maximum and minimum temperatures were recorded (from afternoon to morning), and station location justified these ‘adjustments’. However, lifelong environmentalist Tony Heller has shown that these changes are not justified (e.g. they are applied to stations where there has been no change in circumstances, as is also the case with the BOM in Australia). Heller concluded, “There is overwhelming evidence of fraud in NOAA and NASA’s handling of climate data, and it is very important they are held to account.”59,60
Data tampering was also exposed with the UK’s climate research unit at East Anglia University. The ‘Climategate’ affair broke shortly before the UN climate summit in 2009. The leak of thousands of emails between climate scientists showed that they had deliberately manipulated and hidden data. This is critically important as it impinges upon the integrity of the HadCRUT61 dataset that is the main long-term global temperature record used by the IPCC and many researchers (e.g. Figure 1). Indeed, an independent audit of HadCRUT4 (2018) found very serious errors.62 The researcher, Dr John McLean, summarizes:
… a common but flawed method of data adjustment creates a false warming trend from the adjustments alone. … Ultimately it is argued that the flawed data casts doubt on the credibility of IPCC reports that rely on HadCRUT4 data (or earlier versions of the dataset). Due diligence of these matters by governments twenty or more years ago might have avoided poorly-justified policies on climate and energy.
Sea levels (tidal data)
There is also evidence of fraudulent manipulation of tidal data to give an acceleration in the increase in sea levels, compared to what the raw data have shown over the last 100 years, which is nothing dramatic.63
Fort Denison in Sydney Harbour shows perhaps a 100 mm (4 inches) rise in sea level in 100 years, but even here there have been attempts to manipulate the data to try to make it fit the alarmist expectations.64
There have been massive changes in sea level since Noah’s Flood. From the presence of old shorelines, marine fossils, and small fossil coral reefs on land today, we can see that sea level was about 68 m (220 ft) higher at the end of the Flood than it is today because there were no Greenland and Antarctic Ice Sheets yet. During the following Ice Age, sea level dropped below modern sea level, to about -50 m (-164 ft). In the creation science Ice Age model, the ice sheets had only 40% of the ice estimated by uniformitarian scientists, who claim that sea level dropped to about -120 m (-390 ft) at glacial maximum.65 Thus, there has been an increase in sea level of about 50 m (164 ft) since the end of the Ice Age.
According to satellite measurements, sea levels are now rising at about 3.3 mm/year (33 cm or ~1 foot in 100 years). This assumes that the data are accurate (calibration of the satellites has been criticised; it is quite complex, with many factors affecting it).66
Global sea level cannot be measured locally. Sea level changes are either isostatic (the land moves relative to the sea surface) or eustatic (global ocean levels change). Much of northern Europe is rising, due to rebound after the Ice Age. The mass of ice literally pressed the continental crust down. Now that the ice has melted, the land is still rising.67 The southern UK (which was tipped up by the mass of ice on the northern half of the main island) is sinking for the same reason. In many other areas, land has risen or fallen due to volcanic or tectonic activity. Gravity also affects sea levels. Thus, a loss of ice in Antarctica would cause an increase in sea levels in the northern hemisphere, for example. There are also changes in shore and beach features that affect tidal movement. So, one cannot look at local sea level and assume any changes are true on a global scale. Unquestionably, if ice sheets on land melt, then sea levels will rise. However, there is little evidence of any acceleration in the sea level rise, which the global warming lobbyists seek to bolster their claim that human activity is causing unusual and dangerous global warming.
Geophysicists recently discovered a somewhat surprising and significant contributor to sea level rise, and that is the pumping of groundwater. They found that the global pumping of groundwater from 1993–2010 had contributed over 6 mm rise in sea level.68
Other than thermal expansion, it is only the melting of ice sheets on the land that will cause a rise in ocean levels long term. Thus, if only the Arctic sea ice were to melt completely (producing an ice-free north pole), there would be no sea level rise due to this.69 A study of the Greenland and Antarctica ice volumes, using NASA’s satellite-based laser-measured altitude data (ICESat and ICESat-2 satellites), compared 2003 with 2019.70 The loss of ice over this period was equal to a sea level rise of 14 mm over the 16 years.
A separate study of only Antarctica found ice loss from 1979–2017 (38 years) equivalent to a rise in sea level of 14±2 mm.71 If all the Antarctic ice melted, this would cause a rise in sea level of some 57.2 m (190 feet). This would of course be disastrous to many people globally. However, how long would this take to happen, based on the estimated rates of melting from the most recent period, 2009–2017?65 82,000 years!
Thus, it can be argued that there is no climate emergency. Spending money on an engineering solution to sea water encroachment might make better sense than trying to arrest the ice melting through radical reductions in CO2 emission, when the warming due to human-produced CO2 is likely minimal anyway. Furthermore, the loss of ice volume in Antarctica is very uneven, with the Western and Peninsula areas contributing much of it. And these areas have warmed significantly compared to other parts (see Figure 4 in https://journals.ametsoc.org/view/journals/clim/27/21/jcli-d-13-00733.1.xml). We would not expect such heterogeneity from global warming. Indeed, this has been found to be an area of sub-glacial volcanic activity, as it sits over the West Antarctic Rift System that includes 138 known volcanoes. That is, the melting could occur even if all anthropogenic CO2 production stopped tomorrow.
Engineering solutions are possible with a buoyant economy, but not if it is crippled by ill-conceived taxes and spending on ‘green’ power. Indeed, much of the country of The Netherlands is below sea level, and an engineering solution has been successfully applied. Dutch engineers are now helping Bangladesh and Vietnam in this regard.
A paper on the Denman glacier in Antarctica seemed to underline the need to be prepared with engineering solutions. The authors claimed that if this one glacier melted, global sea level would rise by an impressive 1.5 meters (5 feet).72 According to the refereed research paper, the bottom of the glacier is well below sea level and it is only protected from the sea by a shallow underwater shelf. The edge of the glacier advances and retreats from year to year, so they say that it is possible for the ocean to get underneath the glacier and accelerate melting. This could happen, they say, regardless of global warming. Of course, it would take many years to melt, giving time to apply engineering responses.
However, a recent re-estimation of the ice volume of all 215,000 glaciers outside of Antarctica and Greenland concluded that if they all melted, sea levels would rise “up to 30 cm” (one foot).73 This does not seem to tally with the Denman glacier claim. Indeed, we calculated that the contribution of the Denman glacier would be no more than about 6 mm (1/4 inch)! Note that much of the Denman glacier is sitting on the bedrock (grounded), and the melting of this ice below sea level would take up ~10% less of its volume in sea water (that is, offset some of the melting of grounded ice above sea level), due to the fact that ice is ~10% greater in volume than the liquid water equivalent. It seems that we have to check every claim made in the name of climate ‘science’!
Nevertheless, perhaps it was foolish to build most of our major cities at sea level and then assume the oceans would always stay the same!
Coral reefs
There is a lot of news coverage of the certain demise of the world’s largest reef system, the Great Barrier Reef (GBR), even within 20 years. In a “personal perspective” written by Dr Nancy Knowlton, Sant Chair for Marine Science at the Smithsonian’s National Museum of Natural History, and published in 2012, 90% of the living coral in the central and southern sections would be gone “in just 10 years”.74 Not even close! The reef has been officially surveyed since 1985. There is clear evidence of damage from the crown of thorns starfish and of sporadic damage due to cyclones (typhoons/hurricanes). However, there is little evidence of a long-term downward trend in the amount of hard coral cover recorded (although the commentary might give a different impression).75 Indeed, even the clearly biased Smithsonian commentary acknowledged that only 10% of the claimed losses of coral were attributed to bleaching, which is the only damage that could conceivably be linked to global warming.
While coral bleaching is certainly related to high water temperatures, it is partly a natural consequence of the way coral reefs develop over time, where the upward growth of the reef encloses pools of water that then overheat. A study of the long-term bleaching of the GBR, from drill cores, showed periods of severe bleaching going back to the 1700s, well before any recent ‘global warming’.76
Researchers at James Cook University (JCU) in Townsville, Australia, published eight papers over several years claiming that acidification (from dissolved CO2 creating carbonic acid (nominally H2CO3)) harmed coral reef fish species. However, other scientists were unable to replicate this work and found evidence of data fabrication, such as unrealistically low error values.77
In 2018 Dr Peter Ridd, who had been head of the Marine Geophysical Laboratory at JCU for 15 years, was sacked from his tenured position for criticising the quality of (climate alarmist) research that had been published on the Great Barrier Reef, but he has since been vindicated (see Ref. 76), although not reinstated.
The above examples reveal either deliberate fraud or incredibly sloppy, blinkered thinking with extreme confirmation bias (seeing what you want to see). It is hard to know which it is at times. Scientists can be affected by an emotional desire to fit into their peer community, to keep the research grants rolling in, and also a common human desire to prefer bad news to good news—to ‘fear the worst’ or a ‘prophet of doom’ mentality. There can also be political motivations.
The decline of the Christian ethos in Western society is undoubtedly a major factor in the proliferation of fraud in science generally, which is evident in both evolutionary studies as well as climate science. There is even fraud in experimental science, such as medical drug evaluation, and hard sciences such as physics, but in these areas fraud is much more likely to be uncovered as experiments are repeated.78
The scope of the data tampering reminds us of George Orwell’s 1984:
Day by day and almost minute by minute the past was brought up to date. In this way every prediction made by the Party could be shown by documentary evidence to have been correct….
Orwell wrote 1984 as a warning, but some seem to treat it as a textbook prescription.
Ocean acidification
This topic is not a global warming matter, but it is a potential negative effect of increased atmospheric carbon dioxide levels that deserves consideration.
When the atmospheric CO2 increases, more dissolves in the ocean. This creates a weak acid called carbonic acid (‘H2CO3’) that can affect the availability of calcium carbonate (CaCO3, in the form of aragonite) to creatures such as corals that use it to build their skeletons. It then takes more energy for them to pull the calcium out of the water.
How much of an effect this will have on the sea creatures is an area of current research (and note the fraudulent publications documented above regarding the claimed effect on fish behaviour). There is evidence from in situ experiments with coral communities that they can acclimatize to much higher CO2 levels.79 This is good news if it holds true with further studies.
Indeed, corals have survived much higher CO2 levels in the past, pre-Flood, and immediately post-Flood. However, it may be that the chemical conditions of the oceans at those times were different to the oceans today. These conditions could now be changing to a less optimal state for these organisms specifically, but we don’t know. Other organisms will benefit greatly from increased CO2, such as land plants (see later).
Extreme weather events
Commentators frequently claim that extreme weather events, such as droughts, floods, hurricanes (cyclones), and tornadoes are increasing due to climate change. This has become part of the ‘climate emergency’ or ‘climate crisis’ trope. However, the historical data don’t bear out these claims. A major study published by Italian scientists showed no clear trends in a wide range of extreme weather events: Alimonti, G., and Mariani, L., Is the number of global natural disasters increasing? Environmental Hazards, August 2023; doi.org/10.1080/17477891.2023.2239807. The authors conclude that there is no evidence of an increase in natural disasters that is consistent with global warming causing them. Note that a related paper published in 2022 in Eur. Phys. J. Plus 137 was withdrawn by the publisher in a very non-transparent process after political pressure was brought to bear by a gang that included notorious ‘Climategate’ participants.
4. Other factors that should guide a Christian approach
Christians need to be good stewards of God’s creation, but we need to avoid being hijacked by emotional, unreasoned extremism, especially when it is driven by malevolent political or religious objectives. And, we need always to have an eye for the poor, so that they are not hurt.
Concern for the poor
Unscientific, illogical environmental extremism (e.g. Extinction Rebellion) will hurt the poor the most.80 The poor are not made wealthy by making the rich poor, which is the failed doctrine of communism (Venezuela is the latest casualty). Wealth is created by human enterprise. As the saying goes, a rising tide lifts all boats—meaning that as more wealth is created, everyone benefits, including the poor. This is especially so with a Christian approach to business, where all should prosper (e.g. the principle of gleaning, as with Boaz and Ruth, recorded in Ruth 2).
Indeed, “In the 25 years from 1990 to 2015, the extreme poverty rate dropped an average of a percentage point per year—from nearly 36% to 10%.”81 This progress has been possible because of the growth of wealth due to the extension of free markets (including in China) helped by fossil fuels (mainly coal) that produce cheap and reliable electricity.
This is not to say that the use of fossil fuels is without problems. For instance, there is the associated air pollution, especially small particulates (10 microns and less) and sulfur dioxide, which cause health problems. However, there are technological solutions to these problems that only become feasible as wealth increases. And we always have to ask what the alternative is. In countries too poor for fossil fuels, people burn dung and wood (releasing CO2), and the air pollution can be terrible. Even in the West before the oil boom, whale oil was common for lamps—so the fossil fuel industry helped save the whales!
The UN recognizes the role of fossil fuels in economic prosperity. So the IPCC advocates that the countries that are not poor be nobbled (made poorer), while countries such as China, India, and those in Africa be free to continue using coal for the foreseeable future. However, if the wealth of the richest countries is reduced by radical climate change activism, then they will not be in a good position to purchase products from the developing economies, and so help them prosper.
The welfare of children
Filling kids’ heads with fear and gloom about their future is tantamount to child abuse—and radical climate alarmists have a very real case to answer here. Let kids be kids! Also, getting them to focus on strikes, or playing truant, thus distracting them from learning to excel in science and technology, is not going to help with efforts to develop technology to improve the lives of all in the future, while caring for the environment. They are also being drawn into a false nature-worshipping monist religion that provides no eternal hope, unlike biblical Christianity.
Concern for the environment
- CO2 is ‘plant food’, and planet Earth’s plants would benefit from more of it, not less. Indeed, the increase in CO2 is now responsible for 30% of the world’s biomass production (food and fibre) over the last century, as documented in a paper in Nature in 2017.82 This is food for people and animals. And with more CO2 in the air, plants have to spend less time with their leaf pores (stomata) open. Thus they lose less water during the day and can survive on less water.83 Deserts are greening, largely because of the extra CO2. With the pre-Flood Earth having up to 15 times the CO2 that we have now, plant productivity would have been amazing. That is where fossil fuels came from, as the vegetation of the pre-Flood world was buried during the Flood and then converted into coal and oil. The draw-down in atmospheric CO2, with the burial of much carbon in the ground and the re-vegetation of the earth after the Flood, has resulted in the CO2 ‘drought’ that we are now in. This has been hampering plant productivity and the carrying capacity of planet Earth (at levels from 50–170 ppm, depending on the species, plants die).84
- Historically, the countries that have best cared for the environment are those that are wealthy. And their wealth is due to free markets and cheap energy (coal and other fossil fuels) combined with a Christian ethos, which gives a caring soul to the free market. The worst polluters have been the ones under totalitarian regimes with central control of the economy. They don’t equalize wealth; they equalize poverty, except for the ruling class. So people end up living ‘hand to mouth’ and survival is their priority, not looking after the environment. Extreme action on ‘climate change’ that kills the economies of the wealthy countries will mean that they will be less able to afford to care for the environment.
- The unintended, harmful environmental consequences of focusing on ‘climate change’ need to be considered. With so much focus on ‘climate change’, other environmental issues can be neglected (e.g. plastics pollution of the sea, heavy metals in drinking water, surface water pollution, etc.).
- A particular madness emanating from the focus on fossil-fuel derived CO2 as a driver of global warming is the conversion of coal-fired power stations in the UK and Europe to run on wood. Under the Paris Accord, wood is ‘renewable energy’, but coal is not—hence such crazy rules.
- Another example of unintended consequences is the recent destruction of southeast Asian rainforests to make way for palm oil plantations to produce biofuels. Existing crop areas have also been moved from food production to ethanol production (e.g. maize/corn).
Vested interests are pushing an unscientific agenda
There is a lot of money to be made! For example, former US Vice President Al Gore lives in a mansion that uses 21 times the energy of the average US home. He says that’s OK because he buys carbon credits to offset his ‘carbon footprint’. Where does he buy his carbon credits? From the companies that he founded to trade in carbon credits, which are now worth many millions, having increased in value as he ramped up the hype! The Obamas bought a huge mansion ($US13 million), again with a huge ‘carbon footprint’, which casts doubt on the genuineness of concerns stated about ‘climate change’.
Many climate alarmist celebrities fly everywhere in private jets, although one flight uses more fuel than an SUV does in a year of driving. We might take them all more seriously if they lived by the constraints they demand of the rest of us.
There are so many ‘researchers’ who are on the grant money gravy train, and they are not going to speak out against the misinformation, because otherwise their funding will dry up.
Even electricity generation companies saw a profit opportunity with the shutting down of coal-fired power stations because this became a market disruptor. When that happens, it creates an opportunity for profiteering, because no-one is quite sure what the price of electricity should be any more.
Political agendas associated with climate change alarmism
Much of the misinformation (e.g. arguments that the droughts and bushfires in Australia and elsewhere are due to ‘climate change’) comes from politicians who are using environmentalism as a vehicle to push for sweeping social and political change. They are using fear to generate public support to get their ideas implemented. As a prominent civil servant in the Tony Blair era of UK politics said concerning scaremongering over climate change: “In order to manage risk, you must scare people.”85
The approach of the more radical parties to ‘saving the earth’ is to depopulate it. They push for policies that kill people: abortion up to term with no limitations, infanticide, euthanasia, free-and-easy drugs, transgenderism, and rainbow politics. All of these will create misery, kill people, and decrease the breeding of people (look up their manifestos).
They also work for the destruction of the free markets that have been responsible for a massive movement of people out of poverty in the last 50 years (see World Bank report above). The leaders of these parties know that, if they can destroy free markets through confiscatory taxes and masses of green tape, they will destroy the means for people to make a living and create widespread poverty. At this point they hope the population will, (1) vote for neo-Marxist policies, and (2) decrease. But the environment will suffer (as it has in all Marxist states), but presumably that’s OK because radical environmentalism is just a means to a political end. It is no surprise that these organisations are also strongly anti-Christian, because Christians stand for the sanctity of human life. Climate fear is thus being used to drive radical political change.
Michael Shellenberger has been a prominent climate change activist. He has been a long-time advisor to the IPCC and helped formulate President Obama’s energy policy. He now regrets his role in the fear campaign.86 In his book, Apocalypse Never: Why Environmental Alarmism Hurts Us All (2020), he apologizes for his role in scaring people, especially children, with the idea that climate change represented a global crisis and that the world would end soon unless it was addressed. He exposes many of the false claims and the unintended consequences for the environment. He still believes “climate change is happening. It is just not the end of the world. It’s not even our most serious environmental problem.” On Twitter, Shellenberger commented,
Negativity has triumphed over positivity. In place of love, forgiveness, kindness, and the kingdom of heaven, today’s apocalyptic environmentalism offers fear, anger, and the narrow prospects of avoiding extinction.
He joins a growing list of former advocates for radical action on global warming.
A Christian approach—final thoughts
In summary,
- The politicization of climate science has led to corruption of the science.
- Over the last 100 years or so, the CO2 level has been increasing. However, the temperatures over that time have not been consistent with the hypothesis that human-generated CO2 is the prime cause of temperature increases.
- The science is not ‘settled’, or there would be one model, not over a hundred, that attempts to predict the global temperature. Furthermore, the official climate models that have predicted up to 4.5°C of global warming with a doubling of the CO2 have failed all five tests applied to them. They should be rejected.
- Because positive feedback does not operate, the warming from a doubling of the CO2 is likely to be less than 1°C, which would be beneficial to life on earth. Indeed, this is less than the 1.5°C of warming that the draconian policies formulated to limit CO2 production were set to achieve, based on the failed models.
- The impact of global warming on various natural disasters has been hyped and is not supported by the evidence.
- There is no climate emergency.
- The economic impact of radical policies to limit CO2 will most seriously hurt the poorest people.
- Because humans are intelligent and industrious, we can apply our God-given abilities to solve many (real) environmental issues, especially if we are guided by a Christian worldview.
The idea of dangerous climate change due to burning fossil fuels is unfounded in sound science, and divorced from biblical history.
As part of good stewardship, Christians should be at the forefront of a decision-making process that balances the needs of all the stakeholders: both in terms of economic development and in minimising negative impacts on the environment. A Bible-based approach to government, the environment, and justice will result in human flourishing, as it has in every country that has been strongly influenced by the Bible’s teaching (see The Bible is the bedrock of civilized society).
Clearly, there can hardly be a Christian approach without Christ. Christians need to be pro-active in working to see others come to faith in Christ. In doing that we will also be once again laying the foundations for human flourishing, but also the flourishing of the planet because man is needed to look after it; that’s the way God designed it to be. Indeed, Hosea 2:18–23 connects the health of the land to the spiritual health of the people.
There is a sickness in many once-Christian countries, and it began with the undermining of the Bible as the Word of God from the beginning. When we see the Lord Jesus Christ once again honoured as Creator and Saviour of the world, we will see health return to our nations.
Be sober-minded; be watchful. Your adversary the devil prowls around like a roaring lion, seeking someone to devour. (1 Peter 5:8)
References and notes
- I thank my many colleagues from inside and outside CMI who helped refine this document. Return to text.
- Smith, W.J., Environmentalism’s deep misanthropy, firstthings.com, 25 Jan 2013. Return to text.
- Sarfati, J., The Genesis Account, Ch. 10, 3rd Edn, CBP, 2018. Return to text.
- The aboriginal people were burning (caring for) the Australian countryside in the cool seasons before Europeans came. This reduced the fuel load and thus meant that any fires in the summer were not conflagrations that incinerated man and animal. Return to text.
- Lillie, B., Fighting the growing deserts, with livestock: Allan Savory at TED2013, blog.ted.com, 27 Feb 2013. Return to text.
- Berner, R.A. and Kothavala, Z., GEOCARB III: a revised model of atmospheric CO2 over Phanerozoic time, American J. Science 301:182–204; 2001. Return to text.
- Mararitelli, G. et al., Persistent warm Mediterranean surface waters during the Roman period, (Nature) Sci. Rep. 10:10431, 2020; doi: 10.1038/s41598-020-67281-2 Return to text.
- The thermometer was not invented until 1714, but multiple proxies have been used to ascertain the historical temperatures to achieve a good degree of confidence. Some question whether these were only regional and did not reflect global temperatures. However, the Greenland ice cores and tree rings in China both show the warming. There was also warming in most of Africa and South America (see doi: 10.1002/2017PA003237 and doi:10.1016/j.quaint.2018.10.041). It was clearly global. Return to text.
- 47 Bible verses about God’s sovereignty over the weather; bible.knowing-jesus.com/topics/Weather,-God~s-Sovereignty-Over. Return to text.
- Isles, M., Climate Change Part I—S4E1 The Truth of It (video), Australian Christian Lobby, 1 Nov., 2019; acl.org.au Return to text.
- Interview with Bernard Potter in Neue Zürcher Zeitung [New Zurich Times], 14 Nov 2010. Return to text.
- Basden, S., Extinction Rebellion isn’t about the Climate; medium.com, 10 Jan 2019. Return to text.
- carbonbrief.org/mapped-worlds-coal-power-plants, year 2019. Return to text.
- Kusnetz, N., U.S. Emissions Dropped in 2019: Here’s Why in 6 Charts, insideclimatenews.org, 7 Jan 2020. Return to text.
- Leahy, S., Most countries aren’t hitting 2030 climate goals, and everyone will pay the price: ‘Untold human suffering’ is in our future as nations miss their Paris Agreement targets by a long shot, nationalgeographic.com, 5 Nov 2019. Return to text.
- Nuclear power in the world today, world-nuclear.org, Mar 2020. Return to text.
- Schorn, D., France: Vive Les Nukes, cbsnews.com, 6 Apr 2007. Return to text.
- Kench, P.S. et al., Patterns of island change and persistence offer alternate adaptation pathways for atoll nations, Nature Communications 9:605, 2018 |doi: 10.1038/s41467-018-02954-1. Duvat, V.K.E., A global assessment of atoll island planform changes over the past decades, WIREs Climate Change, 25 Oct. 2018 | doi: 10.1002/wcc.557. Return to text.
- See Crockford, S., State of the Polar Bear 2021: polar bears continued to thrive, polarbearscience.com/2022/02/26/state-of-the-polar-bear-2021-polar-bears-continued-to-thrive, February 26, 2022. Return to text.
- Climate Change Fears of Teen Activist Are Empirically Baseless; youtu.be/MU70facZc6A (10 minute video with references). Script here: justfactsdaily.com/climate-change-fears-of-teen-activist-are-empirically-baseless Return to text.
- Gunn, J., as quoted in Cho, A., A singular conundrum: How odd is our universe? Science 317:1848–1850, 2007. Return to text.
- Bennett, C.L., Science Title Misstep, Letter to the Editor, Science 332:1263, 2011. Return to text.
- Heathers, J., The Lancet has made one of the biggest retractions in modern history. How could this happen? The Guardian, 5 Jun 2020; theguardian.com. Return to text.
- There are arguments about just how much warming has occurred. The terrestrial (surface) thermometer records are problematic because of changes in circumstances and equipment, combined with questionable adjustments made to the historical record (see Data tampering (fraud?) later). Return to text.
- According to IPCC’s AR5 Climate Change 2014 Synthesis Report Summary for Policymakers, p. 4, “About half of the anthropogenic CO2 emissions between 1750 and 2011 have occurred in the last 40 years (high confidence) (Figure SPM.1d). {1.2.1, 1.2.2}. Return to text.
- Houghton, R.A., Balancing the Global Carbon Budget, Annu. Rev. Earth Planet, 2010; annualreviews.org (sourced from NASA, nasa.gov). Return to text.
- Coe, D., Fabinski, W., Wiegleb, G., The Impact of CO2, H2O and Other “Greenhouse Gases” on Equilibrium Earth Temperatures, International Journal of Atmospheric & Oceanic Sciences 5(2):29–40, Dec. 2021; doi: 10.11648/j.ijaos.20210502.12. Return to text.
- Figure 20, p. 22, from Evans, D., Is the Western Climate Establishment Corrupt? (with foreword by Joanne Nova), 46 pp., 2011; jonova.s3. Return to text.
- Numbers as at 30 September 2020. The petition wording and signers’ names and qualifications can be seen at petitionproject.org. The site also has a review of relevant peer-reviewed research. Return to text.
- Cook, J. et al., Quantifying the consensus on anthropogenic global warming in the scientific literature, Environmental Res. Lett., 8(2), 7pp., 2013 |doi: 10.1088/1748-9326/8/2/024024 Return to text.
- Legates, D.R. et al., Climate Consensus and ‘Misinformation’: A Rejoinder to ‘Agnotology, Scientific Consensus, and the Teaching and Learning of Climate Change’, Sci. & Educ. 24: 299–318, 2015 | doi:10.1007/s11191-013-9647-9. See also Dr John Robson’s video, The In-depth Story Behind a Climate Fraud (YouTube, 9 May 2019). Return to text.
- For a comprehensive analysis of the Cook paper, see Montford, A., Fraud, bias and public relations: the 97% ‘consensus’ and its critics, thegwpf.org Note 11, September 2014. Return to text.
- See: Matkin, J.G., Consensus crumbles—global warming is mostly natural—climate is too chaotic to model. Mongolia—1 million cows freeze to death again -56°C (-70°F). 500 Peer reviewed science papers in 2016 are skeptical, academia.edu. Return to text.
- Detailed biographical information, including some of the ad hominem attacks suffered due to their opposition to climate alarmism, at The Top 15 Climate-Change Scientists: Consensus & Skeptics, thebestschools.org, 23 Mar 2020. Return to text.
- Roy Spencer, Ph.D. climatologist, drroyspencer.com. Return to text.
- Crok, M., Prominent scientists warn UN Secretary-General Guterres; www.clintel.org, 23 Sep 2019. Return to text.
- See: creation.com/discrimination-against-creation-scientists. Return to text.
- Dr Peter Ridd was dismissed from James Cook University, Townsville, Australia, for questioning the quality of the climate change research being published by his university. Return to text.
- Bell, P., Pseudoscience and the stifling of debate; creation.com/pseudoscience-stifling-debate, 5 Sep 2013. Return to text.
- IPCC 3rd Assessment Report (‘TAR 2001’). Return to text.
- The absorption spectrum graph is in: van Wijngaarden, W.A. and Happer, W., Dependence of Earth’s Thermal Radiation on Five Most Abundant Greenhouse Gases, Atmospheric and Oceanic Physics arXiv: 2006.03098 (2020); wvanwijngaarden.info.yorku.ca/files/2020/12/WThermal-Radiationf.pdf (f = 0: no CO2, f = 1: 400 ppm, f = 2: 800 ppm).Return to text.
- Climate Change 2001: the Scientific Basis, p.358; www.ipcc.ch/site/assets/uploads/2018/03/WGI_TAR_full_report.pdf. Return to text.
- Evans, D., The skeptics case, jonova.s3.amazonaws.com/guest/evans-david/skeptics-case.pdf (accessed 22 July 2020). Return to text.
- Lewis, M., Satellites and global warming: Dr Christy sets the record straight, 5 Feb. 2016; globalwarming.org (from Dr John Christy’s testimony to the USA House Science Committee hearing on the Paris climate treaty). Return to text.
- Lindzen, R.S. and Choi, Y-S, On the Observational Determination of Climate Sensitivity and Its Implications, Asia-Pacific J. Atmos. Sci. 47(4):377–390, 2011 | doi: 10.1007/s13143-011-0023-x Return to text.
- Harde, H., Radiation transfer calculations and assessment of global warming by CO2, International J. Atmospheric Sciences 2017: Article 9251034, 20 Mar 2017 | doi:10.1155/2017/9251034. Return to text.
- Lewis, N. and Curry, J., The impact of recent forcing and ocean heat uptake data on estimates of climate sensitivity, Journal of Climate, Aug 2018 | doi:10.1175/JCLI-D-17-0667.1 Return to text.
- Polvani, L.M. et al., Substantial twentieth-century Arctic warming caused by ozone-depleting substances, Nature Clim. Change, 2020 | doi:10.1038/s41558-019-0677-4. Return to text.
- Camp, C.D. and Tung, K.K., Surface warming by the solar cycle as revealed by the composite mean difference projection, Geophysical Research Letters 34(14), Jul 2007 | doi:10.1029/2007GL030207. Return to text.
- Svensmark, H., and Friis-Christensen, E., Variation of cosmic ray flux and global cloud coverage—a missing link in solar-climate relationships, J. Atmospheric and Solar-Terrestrial Physics 59(11):1225–1232, 1997 | doi:10.1016/S1364-6826(97)00001-1 Return to text.
- Hebert, L., III, Tinsley, B.A., and Zhou, L., Global electric circuit modulation of winter cyclone vorticity in northern high latitudes, Advances in Space Res. 50(6):806–818, 2012, and papers in J. Creation by Hebert in 2013 and 2014:
Two possible mechanisms linking cosmic rays to weather and climate
Apparent difficulties with a CMAS cosmic ray–weather/climate link
Are cosmic rays affecting high-latitude winter cyclones?
Solar activity, cold European winters, and the Little Ice Age. Return to text. - Climategate Hide the Decline Backgrounder, 4 Dec 2019; video and transcript; climatediscussionnexus.com. Return to text.
- Menton, F., Michael Mann ‘Hockey Stick’ Update: Now Definitively Established To Be Fraud, Manhatten Contrarian, 26 August 2019; www.manhattancontrarian.com Return to text.
- jennifermarohasy.com/temperatures (look at the homogenisation section). Return to text.
- I (DB), was involved in developing alternative battery-powered microprocessor-based-weather stations, and trying to develop a cheap alternative to the traditional (and expensive) Stevenson Screen, which was increasingly adopted for standard weather stations from the 1880s to 1910: Peak, C.M., Fitzell, R.D., Hannah, R.S. and Batten, D.J., Development of a microprocessor-based data recording system for predicting plant disease based on studies on mango anthracnose, Computers and Electronics in Agriculture 1(3):251–62, 1986 | doi:10.1016/0168-1699(86)90012-8. All my attempts to mimic a Stevenson Screen (SS) failed, as all smaller cheap plastic alternatives gave maximum temperatures a degree or two Celsius higher than the SS on calm sunny days. Electronic sensors also over-read the peak temperature as they have less thermal lag than traditional mercury or alcohol bulb thermometers. Modern automated weather stations, which have replaced many SS-based ones, therefore give exaggerated maximum temperatures. Return to text.
- These temperatures were all recorded with a standard Stevenson screen and mercury thermometer, so there is no basis for adjusting them or deleting them. Marohasy, J., Hottest day ever in Australia confirmed: Bourke 51.7°C, 3rd January 1909; jennifermarohasy.com, 10 Jul 2020. Return to text.
- Hansen, J., R., Glascoe, R.J., and Sato, M., GISS analysis of surface temperature change, J. Geophys. Res. 104:30997–31022, 1999 | doi:10.1029/1999JD900835. Return to text.
- Data from NASA’s Goddard Institute for Space Studies (GISS); data.giss.nasa.gov/gistemp/graphs_v3 (last accessed 19 Aug 2020). Return to text.
- 61% Fake Data; realclimatescience.com/61-fake-data (a short history of data manipulation) and realclimatescience.com/no-excuse-for-data-tampering by Tony Heller. Return to text.
- There are many examples of data manipulation from around the world shown graphically here: wattsupwiththat.com/category/land-surface-air-temperature-data Return to text.
- Curry, J., Legacy of Climategate—10 years later; judithcurry.com/2019/11/12/legacy-of-climategate-10-years-later, 12 Nov 2019. Return to text.
- McLean, J., An Audit of the Creation and Content of the HadCRUT4 Temperature Dataset, Oct 2018; robert-boyle-publishing.com Return to text.
- Albert Parker, A. & Ollier, C.D., Is the Sea Level Stable at Aden, Yemen? Earth Systems and Environment 1: article no. 18, 2017; springer.com/article/10.1007/s41748-017-0020-z Return to text.
- co2coalition.org/2020/01/11/thank-god-for-tide-gauges Return to text.
- Oard, M.J., Evidence strongly suggests the Laurentide Ice Sheet was thin, Journal of Creation 30(1):97–104, 2016 and Oard, M.J., Non-glacial landforms indicate thin Scandinavian and British-Irish Ice Sheets, J. Creation 31(2):119–127, 2017. Return to text.
- wattsupwiththat.com/2013/08/02/the-most-important-sea-level-graph illustrates the difficulty of getting a clear picture of sea level changes. Return to text.
- A classical location for isostatic rebound is the Gulf of Bothnia, between Sweden and Finland, where the maximum uplift is 9 mm (0.35 inch) annually. Return to text.
- Seo, K-W, et al., Drift of Earth’s Pole Confirms Groundwater Depletion as a Significant Contributor to Global Sea Level Rise 1993–2010, Geophys. Res. Lett. 50(12) e2023GL103509, 28 June 2023; doi.org/10.1029/2023GL103509 Return to text.
- Archimedes’ Law of Buoyancy states that the buoyant force is equal and opposite to the weight of the fluid displaced. At equilibrium, the iceberg’s whole weight = the weight of the water displaced. It follows that if this melts, it will form the same weight of water as that displaced. Therefore the liquid’s volume and level will not change. Return to text.
- Smith, B. et al., Pervasive ice sheet mass loss reflects competing ocean and atmosphere processes, Science 368(6496):1239–1242, 12 Jun 2020 | doi:10.1126/science.aaz5845. Return to text.
- Rignot, E. et al., Four decades of Antarctic Ice Sheet mass balance from 1979–2017, PNAS 116(4):1095–1103, 22 Jan., 2019 | doi:10.1073/pnas.1812883116 Return to text.
- Brancato, V. et al., Grounding Line Retreat of Denman Glacier, East Antarctica, Measured With COSMO—SkyMed Radar Interferometry Data, Geophysical Res. Letters 47: e2019GL086291 |doi:10.1029/2019GL086291 Return to text.
- ETH Zurich, Ice volume calculated anew, ScienceDaily, 12 February 2019; sciencedaily.com/releases/2019/02/190212092603.htm. Return to text.
- Knowlton, N., The Great Barrier Reef—Going, Going, Gone??? Oct. 2012; ocean.si.edu/ecosystems/coral-reefs/great-barrier-reef-going-going-gone Return to text.
- Australian Institute of Marine Science, Long-term Reef Monitoring Program—Annual Summary Report on coral reef condition for 2018/19; www.aims.gov.au. Note particularly figures 2, 4, and 6. The cyclones that caused the major declines are mentioned in the commentary. Return to text.
- Kamenos, N.A. and Hennige, S.J., Reconstructing Four Centuries of Temperature-Induced Coral Bleaching on the Great Barrier Reef, Frontiers in Marine Science 5:283, 2018 (note Figure 4) | doi:10.3389/fmars.2018.00283 Return to text.
- Clark, T.D. et al., Ocean acidification does not impair the behaviour of coral reef fishes, Nature 577:370–375, 8 Jan 2020 | doi:10.1038/s41586-019-1903-y. See also: Enserink, M., Star marine ecologist guilty of misconduct, university says: University of Delaware finding vindicates whistleblowers, Science 377(6607):699–700, 12 August, 2022. Return to text.
- Hartnett, J., The problem with science is that so much of it simply isn’t, J. Creation 31(2):6–7, 2017; creation.com/science-fraud. Return to text.
- Doo, S.S., Edmunds, P.J., and Carpenter, R.C., Ocean acidification effects on in situ coral reef metabolism. Sci. Rep. 9:12067, 2019 | doi: 10.1038/s41598-019-48407-7 Return to text.
- See: Protect the poor: Ten reasons to oppose harmful climate change policies, cornwallalliance.org, accessed 17 Jul 2020. The Cornwall Alliance presents a reasoned and compassionate Christian approach to environmental matters: Dr E. Calvin Beisner is the principal, and a biblical creationist. Return to text.
- World Bank report 2018: worldbank.org/en/news/press-release/2018/09/19/decline-of-global-extreme-poverty-continues-but-has-slowed-world-bank. Return to text.
- Campbell, J.E. et al., Large historical growth in global terrestrial gross primary production, Nature 544:84–87, 6 Apr 2017 | doi:10.1038/nature22030. The IPCC’s Climate Change and Land also reports a global net greening in section A2.3; ipcc.ch/site/assets/uploads/2019/08/4.-SPM_Approved_Microsite_FINAL.pdf. Return to text.
- Carbon Dioxide Fertilization Greening Earth, Study Finds, nasa.gov, 26 Apr 2016; nasa.gov. Return to text.
- According to secular researchers, CO2 levels were particularly low at the ‘Last Glacial Maximum’ (LGM). This corresponds with the end of the post-Flood ice age. This fits with the draw-down of atmospheric CO2 with the revegetation of planet Earth, combined with the cooling of the oceans resulting in more CO2 dissolved in the cold ocean water. Return to text.
- Lawson, N., An appeal to reason: The economics and politics of climate change, Centre for Policy Studies, 1 Nov. 2006. Return to text.
- Delingpole, J., Forbes cancels environmentalist who wrote ‘I Apologize for the Climate Scare’, breitbart.com, 30 June 2020. Return to text.


Readers’ comments
Comments are automatically closed 14 days after publication.