

Journal of Creation 33(3):8–11, December 2019
Browse our latest digital issue Subscribe
South Caspian Basin supports a late Cenozoic Flood boundary

Repeated claims since the mid-1990s have been made by some creation scientists that the K-Pg (Cretaceous-Paleogene) boundary marks the end of the Flood and the end of marine deposition across the continents.1-4 Furthermore, they claim that the massive volumes of post–K-Pg sediments observed globally are the result of post-Flood local catastrophes. In contrast, other creation scientists have contended that the K-Pg was not the end of the Flood and that Flood processes continued through much of the Cenozoic section.5-13 While acknowledging that the K-Pg boundary may have been the high water point of the Flood, they interpret much of the Cenozoic strata as the receding phase.
Massive Cenozoic marine deposits across North Africa, the Middle East, and Europe
The results of an examination of the sedimentary rocks across North Africa and the Middle East and across much of Central Europe dramatically conflicts with the prevailing K-Pg interpretation for the end of the Flood.12,13 These rocks show marine depositional processes continuing well into the Upper Cenozoic, supporting the premise that the Tertiary (Paleogene and Neogene) was the receding phase of the Flood and not post-Flood. In fact, many of these areas show uninterrupted deposition of carbonate rocks across the K-Pg boundary, from the Cretaceous through the Miocene.
Massive marine deposits across such vast areas of the world indicate that Flood processes were still active well into the Upper Cenozoic, with strata extending across most of Syria and Iraq; these are areas just to the south of where the Ark landed and where the Tower of Babel was built.14 It is hard to imagine attempting to build a civilization while still under the waters of a Flood. What better proof could be found to make the case that the Flood could not have ended at the K-Pg, but continued through the Miocene at least?
Southern Caspian Basin marine sediments extend through the Miocene
An examination of the rocks in the South Caspian Basin provides additional confirmation of a late Cenozoic Flood boundary. This area also shows continuous marine strata from the Cretaceous level upwards through the Miocene, and even as high as the Lower Pliocene in the Middle Caspian Basin just to the north.15

Indeed, the Miocene marine rocks in the South Caspian Basin are the source rocks for much of the oil produced in the vicinity. These rocks have been studied by oil and gas companies and found to contain tremendous volumes of buried marine algae; some of these shales contain up to 12.39% TOC (total organic carbon).15
The primary source rocks in the South Caspian Basin are the Oligocene to Lower Miocene Maykop Series and the overlying Middle-Upper Miocene Diatomaceous Suite, which collectively are several kilometres thick.16-18 These strata were buried by upwards of 8 km (5 mi) of additional Cenozoic deposits, placing them in the oil generation window. Devlin et al. made special note of the maturity level of these sediments, stating:
“The ubiquitous nature of this source facies throughout much of the coastal and offshore regions of the South Caspian Basin is evidenced by prolific seepage of black oil.” 19
Massive volume of Cenozoic sediments in South Caspian Basin
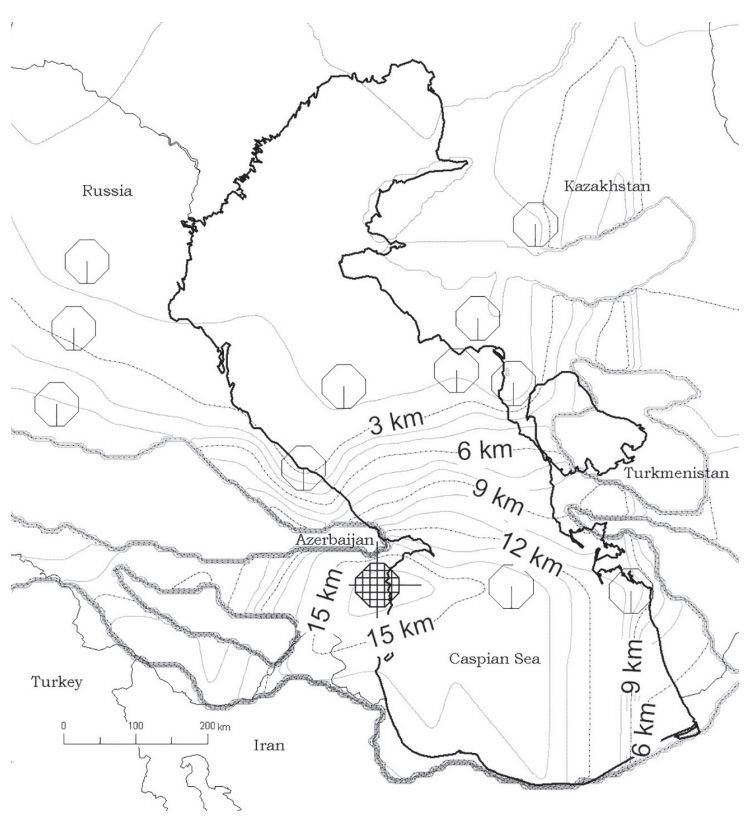
In total, the South Caspian Basin contains up to 17 km of Tertiary (Paleogene and Neogene) sedimentary rocks (figure 1), spread across a width of about 480 km (300 mi) and a surface area of about 181,000 km2 (figure 2).16 To our knowledge, this is one of the thickest deposits of Tertiary sediment anywhere in the world.
If we assume all of the Tertiary rocks deposited here were post-Flood, then the bulk of these strata would have had to have been emplaced without any Flood influence and in a limited window of time prior to the onset of the Pleistocene Ice Age. Recall, the conditions for the Ice Age would have only been in place for a limited number of years after the Flood. The warm oceans from the creation of a new seafloor would have cooled and the prolific volcanic eruptions of ash-rich volcanoes would have begun to wane within a few centuries of the Flood cessation. As a consequence, the beginning of the Ice Age limits the window of time available for most of the Tertiary deposits to about 100 years, or at most 200 years.20 If we assume a thickness of 15 km, then an average of 150 m of sediment per year must have been continually deposited across the South Caspian Basin in the timespan of 100 years. This equates to 12.5 m (41 ft) per month across an area of 181,000 km2. This is no trivial volume in that short window of time. And even if we stretch the timeframe to 200 years, we still get an average of 6.25 m (20.5 ft) per month.
It is difficult to imagine local catastrophes creating this volume of sediment across such a vast area in such a limited amount of time. Also, how could anything survive in an area with this much active deposition?
Rocks indicate the post-Flood boundary was in the late Cenozoic
Once again, the claim that mostly continental rocks were deposited after the K-Pg boundary is shown to be utterly false. Uninterrupted marine deposition from the Cretaceous through the Upper Miocene is seen all across Central Europe, North Africa, Syria, and Iraq, and the South Caspian Basin. This prevents the picking of a post-Flood boundary any earlier than the end of the Miocene across this region. The receding phase of the Flood must have continued to deposit sediment throughout most of the Cenozoic across vast regions of Europe, Africa, and parts of Asia at least. Even many of the deposits in the upper Cenozoic across North America are better explained by the receding phase of the Flood, like the vast Ogallala Formation spread across the Great Plains States of the USA.21
Interpretations must be measured by the strength of the data
Any scientific debate must be measured by the strength of the data supporting each viewpoint. Massive volumes of rock data that support an upper Cenozoic Flood boundary are far more compelling than merely basing conclusions on limited types of fossil data found in isolated locations. Fossil data depends on what is exposed and/or has been discovered. As such, it is always more biased as it likely does not give us a true representation of the extent of the fossils themselves. Fossil data relies on what has been discovered, the preservation conditions, and the amount of volume exposed from erosion. Interpreting it is, by nature, very subjective.
Stratigraphic data is the most compelling type of data
Stratigraphic data is not as biased as fossil data and is much less subjective. It is a directly observable record of what has been deposited. Although some of the rock record has obviously been destroyed by erosion, what has been preserved is still telling. Indeed, the overwhelming strength of the global rock record needs to be acknowledged in any interpretation of the Flood/post-Flood boundary.
The sheer volume and global extent of marine rocks deposited during the Tertiary is what tips the scale in favour of an upper Cenozoic post-Flood boundary. We suggest that this data set is so vast and complete that it is nearly inconceivable to argue otherwise.
References and notes
- Austin, S.A., Baumgardner, J.R., Humphreys, D.R., Snelling, A.A., Vardiman, L., and Wise, K.P., Catastrophic plate tectonics: a global Flood model of Earth history; in: Walsh, R.E. (Ed.), Proceedings of the Third International Conference on Creationism, Creation Science Fellowship, Pittsburgh, PA, pp. 609–621, 1994. Return to text.
- Whitmore, J.H. and Garner, P., Using suites of criteria to recognize pre-Flood, Flood and post-Flood strata in the rock record with application to Wyoming (USA); in: Snelling, A.A. (Ed.), Proceedings of the Sixth International Conference on Creationism, Creation Science Fellowship, Pittsburgh, PA, pp. 425–448, 2008. Return to text.
- Whitmore, J.H. and Wise, K.P., Rapid and early post-Flood mammalian diversification evidenced in the Green River Formation; in: Snelling, A.A. (Ed.), Proceedings of the Sixth International Conference on Creationism, Creation Science Fellowship, Pittsburgh, PA, pp. 449–457, 2008. Return to text.
- Ross, M.R., Evaluating potential post-Flood boundaries with biostratigraphy—the Pliocene/ Pleistocene boundary, J. Creation 26(2):82–87, 2012. Return to text.
- Holt, R.D., Evidence for a Late Cainozoic Flood/ post-Flood boundary, J. Creation 10(1):128–167, 1996. Return to text.
- Oard, M.J., Flood processes into the late Cenozoic: part 1—problems and parameters, J. Creation 30(1):63–69, 2016. Return to text.
- Oard, M.J., Flood processes into the late Cenozoic: part 2—sedimentary rock evidence, J. Creation 30(2):67–75, 2016. Return to text.
- Oard, M.J., Flood processes into the late Cenozoic: part 3—organic evidence, J. Creation 31(1):51–57, 2017. Return to text.
- Oard, M.J., Flood processes into the late Cenozoic: part 4—tectonic evidence, J. Creation 31(1):58–65, 2017. Return to text.
- Oard, M.J., Flood processes into the late Cenozoic: part 5—geomorphological evidence, J. Creation 32(2):70–78, 2016. Return to text.
- Oard, M.J., Flood processes into the late Cenozoic: part 6—climatic and other evidence, J. Creation 33(1):63–70, 2019. Return to text.
- Clarey, T.L., Local catastrophes or receding Floodwater? Global geologic data that refute a K-Pg (K-T) Flood/post-Flood boundary, CRSQ 54(2):100–120, 2017. Return to text.
- Clarey, T.L. and Werner, D.J., Global stratigraphy and the fossil record validate a Flood origin for the geologic column; in: Whitmore, J.H. (Ed.), Proceedings of the Eighth International Conference on Creationism, Creation Science Fellowship, Pittsburgh, PA, pp. 327–350, 2018. Return to text.
- Clarey, T., Rocks reveal the end of the Flood, Acts & Facts 48(5):9, 2019. Return to text.
- Ulmishek, G.F., Petroleum geology and resources of the Middle Caspian Basin, former Soviet Union, U.S. Geological Survey Bulletin 2201-A, U.S. Department of the Interior, 2001. Return to text.
- Dyman, T.S., Litinsky, V.A., and Ulmishek, G.F., Geology and natural gas potential of deep sedimentary basins in the former Soviet Union, U.S. Geological Survey Open-File Report 99-381, U.S. Department of the Interior, 1981. Return to text.
- Devlin, W.J., Cogswell, J.M., Gaskins, G.M. et al., South Caspian Basin: Young, cool, and full of promise, GSA Today 9(7):1–9, 1999. Return to text.
- Guliyev, I., Aliyeva, E., Huseynov, D., Feyzullayev, A., and Mamedov, P., Hydrocarbon potential of ultra deep deposits in the South Caspian Basin, AAPG Search and Discovery Article #10312, 2011. Return to text.
- Devlin et al., ref. 17, p. 7. Return to text.
- Clarey, T.L., The Ice Age as a mechanism for post-Flood dispersal, J. Creation 30(2):48–53, 2016. Return to text.
- Clarey, T., Palo Duro Canyon rocks showcase Genesis Flood, Acts & Facts 47(7):10, 2018. Return to text.


Readers’ comments
Comments are automatically closed 14 days after publication.