
Antarctic and Greenland Ice Sheets explained within biblical history

The history of the earth’s beginnings in Genesis 1–11, which includes Noah’s Flood, is challenged on many fronts. Creationists have answered many of these challenges using the latest scientific data and staying faithful to the scriptural account.1,2 Secular scientists claim creation scientists have no explanation for the origin of the Antarctic and Greenland Ice Sheets (figures 1 and 2). This article reveals we do have answers.3
One challenge is the vast ages secular scientists proclaim for the ice sheets: ages much greater than the biblical age of the earth. Examples are 110,000 years for the Greenland ice sheet and 800,000 years for the East Antarctic sheet. The post-Flood Ice Age model answers these challenges, as has been described in many places.4 A summary is presented below in the box Answers to secular ‘ice-related’ challenges to biblical timescale.
Here we will show that the post-Flood Ice Age model not only explains the rapid formation of the ice sheets, but also the different features of the Arctic and Antarctic sheets. There are three specific parameters at work, namely the elevation of the bedrock at the beginning of the Ice Age, the beginning time of ice accumulation after the Flood, and the rate of snowfall and ice accumulation.5
1. Bedrock elevation at the beginning of the Ice Age
By the principle of isostasy, as the ice accumulated its weight would have pushed down the crust and the bedrock (figure 3). We can estimate the bedrock elevation at the beginning of the Ice Age by taking the thickness of the ice and dividing it by three (because rock is about three times as heavy as the same volume of ice). We then add this to the current elevation of the bedrock, detected by radar. If the bedrock elevation was high at the beginning of the Ice Age the ice would have begun to accumulate early. If the elevation was low, ice accumulation would have been delayed.
2. The beginning of ice accumulation
The warm water in the oceans delayed the start of ice accumulation. For the ice cores in Greenland, I estimate that the delay was between 100 to 200 years, depending upon their proximity to the warm ocean. The delay was because snow and ice would first develop in the mountains, but all the ice cores are at low altitudes.

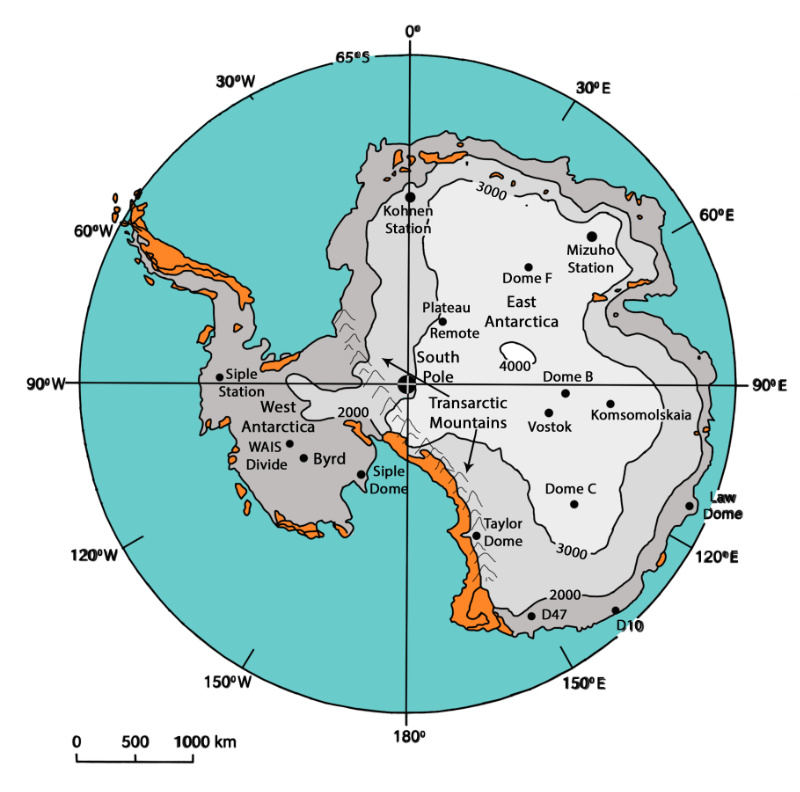
Ice cover in the Antarctic can be considered as two ice sheets: (1) the West Antarctic Ice Sheet (WAIS), and (2) the East Antarctic Ice Sheet (figure 2). The West Antarctic Ice Sheet now covers an area that was originally half mountains and half ocean. At the beginning of the Ice Age the ocean was warm, so the snow and ice first accumulated rapidly in the highest mountains. With time the ice gradually descended to sea level. As the sea water cooled, floating ice eventually developed and spread over the sea water. Further ice accumulation pressed the floating ice down until eventually the ice sheet rested on the ocean floor.
The ice cores allow us to estimate the timing for the beginning of ice accumulation. The Byrd ice core (figure 2) started near sea level, so we again conclude the ice began to accumulate around 200 years after the Flood, since it would take about this time for the ice accumulation to descend from the mountains to sea level. However, the new WAIS Divide ice core (figure 2) began about 500 m below sea level, so it would have taken around 300 years for ice to start accumulating at this elevation.
For the East Antarctic ice core locations, snow and ice began accumulating almost immediately after the Flood. This is because they were around 1,000 m above sea level on a large land mass near the South Pole.
3. The ice accumulation rate
The warmer the water, the greater the evaporation. Eight times as much water can be evaporated at a sea surface temperature of 30°C than at 0°C. Thus, snowfall would be extreme at the beginning of the Ice Age, decreasing slowly in the middle and end of the Ice Age as the ocean water cooled.

I estimate that ice accumulation rates at the beginning of the Ice Age would start at around 5 to 20 metres (16 to 65 feet) per year. This is based on measured winter snowfall in some areas of the earth, but I allowed for accumulation for the whole year, and corrected for extra evaporation due to a very warm ocean at the start of the Ice Age.
Examples of heavy snowfall are found in northwest Japan (figure 4) and the Cascade Mountains of Washington State, USA. The yearly average ice accumulation at Paradise Ranger Station at the 1,646 m level of Mount Rainier, Cascade Mountains, from October to March is about 2.5 m. If snow fell all year around, the total would be 5 m/yr. A year with very heavy snow could be 10 m/yr if it continued all year around.
The snowfall in these heavy snow areas depends especially upon the sea surface temperatures, which range from 5 to 12°C in the moisture source area: (1) the Sea of Japan for northwest Japan and (2) off the Pacific coast for the Cascade Mountains. But the snowfall rate would be much greater with sea surface temperatures of 20–30°C off the coasts of Greenland and Antarctica, which was the situation at the beginning of the post-Flood Ice Age.
How the different features of the different ice cores are explained
Based on the three variables itemized above, the different features of the ice cores can be explained. Since the East Antarctic ice core locations started off at elevations of about 1,000–2,000 m near the South Pole, heavy snow accumulation would begin very soon after the Flood. These locations would gain about half their ice in the first 200 years and show numerous oscillations. Generally, this ice would have accumulated before ice began to accumulate at the Greenland and West Antarctic ice core locations. The top half of the East Antarctic ice cores would correspond to the accumulation of the Greenland and Byrd ice cores, showing one Ice Age. But since the WAIS Divide ice core location was in the ocean in between mountains in West Antarctica, ice only began to accumulate about 300 years after the Flood. Hence the ice core only covers about half the Ice Age.
Thinking biblically and closely examining the evidence
The different features of the Greenland, East Antarctic, and West Antarctic ice sheets seem contradictory at first. But these differences are explained by a close examination of the observed evidence using a post-Flood Ice Age model. This is consistent with the Bible’s history: “Examine everything carefully; hold fast to that which is good” (1 Thessalonians 5:21, NASB). In this way we can explain many other challenges to biblical Earth history.
Answers to secular ‘ice-related’ challenges to biblical timescale
Secular scientists claim they can count up to 110,000 annual layers in the Greenland Ice Sheet. Earlier they reported counting 85,000 layers, but this number did not agree with the astronomical theory of the ice ages. So, they redated the ice core, changed their assumptions and interpretations, and conveniently ‘found’ 25,000 more layers.6,7 The problem is that this number contradicts the biblical age of the earth.
Secular scientists date the East Antarctic Ice Sheet at more than 800,000 years old since they claim they can count eight ice-age cycles in the ice cores. However, the snowfall is much too low to be able to see annual layers at the top, so they arrive at the age of the ice sheet, not by counting individual layers but, by relating large-scale variations in the cores to the assumed astronomical theory of the ice ages.8 Once again, this number conflicts with the biblical timescale.
The astronomical theory of ice ages
To resolve this contradiction, it is important to understand how secular scientists date the ice cores. Ice core dating is irrevocably tied up with the astronomical theory of ice ages. This theory is unquestioned by secular scientists, and is the reason they believe there were about 50 ice ages of various intensities in the past supposed 2.6 million years.9 It is also called the Milankovitch theory, after the man who developed it the most. The idea is that the earth’s orbital parameters gradually change in cycles over tens of thousands of years, and this affects the earth’s climate. One such parameter is the shape of the earth’s orbit around the sun. It is thought that every 100,000 years the orbit changes from a circle to an ellipse and back again.
The problem is that this 100,000-year cycle would make very little difference to the amount of solar radiation that reaches the earth, and so the calculated effect is far too small to create an Ice Age.10 Paillard says:
Furthermore, during the past 1 million years, glacial-interglacial oscillations have largely been dominated by a 100,000-year periodicity, yet there is no notable associated 100,000-year [solar] insolation forcing. There is currently no consensus on what drives these late Pleistocene 100,000-year cycles.11
Secular scientists explain ice sheets using uniformitarianism and deep time
When we examine the ice sheets more closely, we discover that secular scientists are interpreting the ice core observations based on the long-age assumption of uniformitarianism. So, they think the ice sheets built up by presently observed processes at today’s rates of precipitation. We agree it would take a long time for the ice sheets to develop if this were the case, but it is not.
Another assumption is that the ice sheets have stayed at about their current thickness for millions of years. In particular, secular scientists assume the Antarctic Ice Sheet started building about 40 million years ago, reached its current height 15 million years ago, and remained generally steady to the present day. In short, the long ages for the ice sheets have not been measured but assumed, based on uniformitarianism.
The rapid post-Flood Ice Age can explain the ice sheets
The creation answer is that the global Flood catastrophe provided the unique conditions that allowed the Ice Age to form. Specifically, the Flood produced a warm ocean, which would have surrounded the Greenland and Antarctic Ice Sheets, with massive evaporation. Because of their latitude, multiple snowstorms resulting from this moisture-laden air would have caused the ice sheets to develop rapidly.12,13 Then as the oceans cooled, ending the Ice Age after some 700 years,14,15 the rate of growth of the ice sheets would have slowed, decreasing to the growth rates we observe today.
References and notes
- Batten, D. (Ed.), The Creation Answers Book: More than 60 of the Most-Asked Questions about Creation, Evolution, and the Book of Genesis Answered! Creation Book Publishers, Powder Springs, GA, 2009. Return to text.
- Oard, M.J. and Reed J.K. (Eds.), Rock Solid Answers: The Biblical Truth Behind 14 Geological Questions, Master Books and Creation Research Society Books, Green Forest, AR and Chino Valley, AZ, 2009. Return to text.
- Oard, M.J., Are the Greenland and Antarctic Ice Sheets Old? Creation 35(4):46–49, 2013; creation.com/ice-sheet-age. Return to text.
- Such as, Oard, M.J., The unique post-Flood Ice Age, Creation 41(4):44–47, 2019; creation.com/ice-age-model Return to text.
- Oard, M.J., Ice core oscillations and abrupt climate changes—Part 3: Large-scale oscillations within biblical earth history, J. Creation 35(2):107–115, 2021; creation.com/ice-core-oscillations-3 Return to text.
- Meese, D.A., Gow, A.J., Alley, R.B., Zielinski, G.A., Grootes, P.M., Ram, K., Taylor, K.C., Mayewski, P.A. and Bolzan, J.F., The Greenland Ice Sheet Project 2 depth-age scale: methods and results, J. Geophysical Research 102(C12):26411–26423, 1997. Return to text.
- Oard, M.J., Do Greenland ice cores show over one hundred thousand years of annual layers? J. Creation 15(3):39–42, 2001; creation.com/do-greenland-ice-cores-show-over-one-hundred-thousand-years-of-annual-layers. Return to text.
- Oard, M.J., The Frozen Record: Examining the Ice Core History of the Greenland and Antarctic Ice Sheets, Institute for Creation Research, Dallas, TX, 2005. Note that they first matched variations in the ice cores to wiggles in deep-sea cores, which had been related to the astronomical theory. The whole process is highly subjective. Return to text.
- Walker, M. and Lowe, J., Quaternary science 2007: a 50-year retrospective, Journal of the Geological Society London 164:1,073–1,092, 2007. Return to text.
- Oard, M. J., Astronomical troubles for the astronomical hypothesis of ice ages, J. Creation 21(3):19–23, 2007; creation.com/astronomical-troubles-for-the-astronomical-hypothesis-of-ice-ages. Return to text.
- Paillard, D., What drives the ice age cycle? Science 313:455–456, 2006; p. 456. Return to text.
- Oard, M.J., Ice core oscillations and abrupt climate changes: part 1—Greenland ice cores, J. Creation 34(3):99–108, 2020; creation.com/ice-core-oscillations-1. Return to text.
- Oard, M.J., Ice core oscillations and abrupt climate changes: part 2—Antarctic ice cores, J. Creation 35(1):70–77, 2021; creation.com/ice-core-oscillations-2. Return to text.
- Oard, M.J., Frozen in Time: Woolly Mammoths, the Ice Age, and the Biblical Key to Their Secrets, Master Books, Green Forest, AR, 2004. Return to text.
- Oard, M.J. (DVD), The Great Ice Age: Evidence from the Flood for Its Quick Formation and Melting, Awesome Science Media, Richfield, WA, 2013. Return to text.


Readers’ comments
Comments are automatically closed 14 days after publication.